A Guide to Modern Marketing Reporting

Maxime Dupré
11/8/2025

Let's be honest, marketing can sometimes feel like you're throwing spaghetti at the wall to see what sticks. You launch campaigns, create content, and run ads, but how do you really know what's working? That's where marketing reporting comes in.
Simply put, marketing reporting is the process of taking all that raw data from your campaigns and turning it into a clear story. It answers the big questions: What did we do? How did it go? And what should we do next? Think of it less like a report card and more like a GPS for your marketing efforts—it shows you exactly where you are and maps out the best path to your destination.
The Foundation of a Data-Driven Strategy

Without a solid reporting process, you're essentially marketing in the dark. Sure, you're busy, but are you being effective? It's like a ship sailing without a compass. You’re definitely moving, but you could be going in circles for all you know.
Good reporting is the backbone of any marketing team that gets real results. It transforms a jumble of abstract numbers—clicks, impressions, conversion rates—into a clear, compelling narrative about your performance. This story is what you use to prove your value, justify your budget, and get everyone, from marketing to sales to the C-suite, on the same page.
It's More Than Just a Data Dump
A huge mistake I see teams make is confusing a data dump with a real report. A spreadsheet with a thousand rows of numbers isn't a report; it’s a headache. It's just raw data waiting for someone to make sense of it.
Real reporting is about providing context. It answers the all-important "so what?" for every single metric.
The goal of a report isn't to bury stakeholders in data, but to tell them a story. It’s about translating numbers into a narrative that explains what happened, uncovers new opportunities, and points the way forward.
This is what separates the pros from the amateurs. Instead of just listing off metrics, they connect the dots to actual business outcomes. For instance, a weak report might say, "Website traffic went up by 20%." A strong report will say, "Our new blog strategy drove a 20% increase in website traffic, which led to a 15% rise in qualified leads and added $50,000 to the sales pipeline." See the difference?
The Core Benefits of Consistent Reporting
When you get into a regular rhythm of creating and analyzing marketing reports, you build a culture of accountability and continuous improvement. It’s a game-changer.
Here are the key advantages you’ll see:
- Demonstrate Marketing ROI: Finally, you'll have the hard evidence to show exactly how marketing drives revenue. This makes getting budget approvals and executive buy-in so much easier.
- Make Smarter Strategic Decisions: Your reports will shine a spotlight on which channels, campaigns, and messages are hitting the mark, so you can stop wasting money and double down on what works.
- Optimize Campaign Performance: By keeping a close eye on performance, you can quickly spot a campaign that's tanking and fix it, or identify a winner and pour more fuel on the fire.
- Get Everyone Aligned: When marketing, sales, and leadership are all looking at the same numbers, you create a unified vision and ensure everyone is pulling in the same direction.
At the end of the day, marketing reporting isn't just about crunching numbers. It's about building a predictable engine for growth and proving the incredible value your marketing team brings to the table.
Anatomy of an Effective Marketing Report
A great marketing report does more than just present numbers on a page—it tells a story. Think of it as the strategic narrative of your marketing efforts. A jumbled report is like a map with no legend; all the pieces are there, but you have no idea how to get where you're going. A well-crafted one, on the other hand, guides you, highlighting what worked, what didn't, and where the real opportunities are.
The secret is in the structure. A truly effective report anticipates what your audience needs to know and delivers it in a logical sequence. It starts with the big picture and then carefully drills down into the details. This approach means the CEO can get the bottom line in two minutes, while a channel specialist can find the nitty-gritty data they need to optimize a campaign.
Start with the Executive Summary
Every single report should kick off with an executive summary. Let's be honest, this is often the only part a busy executive will read, so you have to make it count. Your mission here is to deliver the most crucial information in 60 seconds or less.
This "at a glance" section needs to nail three questions:
- What were we trying to do? Briefly state the goals for the period.
- Did we do it? Give a straight answer, backed by one or two headline-worthy numbers (like total revenue generated or new leads acquired).
- So what? What's next? Point out the single biggest takeaway and recommend the most important next step.
Putting this right at the top ensures your main message lands immediately, even if your reader never scrolls down.
Choose KPIs That Actually Reflect Business Goals
The heart of any report is the data, specifically your Key Performance Indicators (KPIs). But here’s a common trap: reporting on vanity metrics. These are the numbers that feel good to look at—like social media likes or total impressions—but don’t really connect to what the business cares about: growth and revenue.
Your focus should always be on metrics that have a clear line to business outcomes. Your report needs to show how marketing is making an impact.
An effective report translates marketing activities into business impact. It shifts the conversation from "we got 10,000 impressions" to "our campaign generated 200 qualified leads, resulting in a $50,000 sales pipeline."
For example, don't just report on website traffic; report on the conversion rate of that traffic. Instead of just showing email open rates, highlight the click-through rate that led to demo sign-ups. This is how you prove your value. Many agencies have mastered this approach for streamlining client reporting, ensuring they always focus on what matters most to their clients.
Use the Right Metrics for the Job
Choosing the right KPIs can feel overwhelming, but breaking them down by marketing domain makes it much clearer. The goal is to select a mix of primary metrics that track core objectives and secondary metrics that provide deeper context.
Here's a look at some essential metrics you should consider for a comprehensive marketing report:
Essential Metrics for a Comprehensive Marketing Report
| Domain | Primary Metrics | Secondary Metrics | Purpose |
|---|---|---|---|
| SEO | Organic Traffic, Keyword Rankings, Conversion Rate from Organic | Backlinks Acquired, Domain Authority, Bounce Rate | Measures visibility in search engines and the quality of traffic driven. |
| Content Marketing | Leads Generated, Time on Page, Unique Pageviews | Social Shares, Comments, Downloads (e.g., ebooks) | Tracks engagement and the content's ability to attract and convert visitors. |
| Paid Advertising (PPC) | Cost Per Acquisition (CPA), Return on Ad Spend (ROAS), Conversion Rate | Click-Through Rate (CTR), Cost Per Click (CPC), Quality Score | Evaluates the financial efficiency and effectiveness of paid campaigns. |
| Email Marketing | Click-Through Rate (CTR), Conversion Rate, Unsubscribe Rate | Open Rate, List Growth Rate, Bounce Rate | Assesses audience engagement and the direct impact of email campaigns. |
| Social Media | Engagement Rate, Conversions from Social, Follower Growth | Reach, Impressions, Mentions | Gauges audience interaction and the role social media plays in the funnel. |
By selecting metrics from the "Primary" column, you keep your report focused on results. The "Secondary" metrics are perfect for adding color and diagnosing performance when you need to dig deeper.
Visualize Data for Instant Clarity
We are wired to process visuals. Our brains can understand a chart or a graph in a fraction of the time it takes to read through a dense table of numbers. That’s why data visualization isn’t just a nice touch; it’s a critical tool for making your report clear and persuasive.
Follow a few simple rules for powerful visuals:
- Use line charts to illustrate trends over time, like lead growth or monthly website traffic.
- Employ bar charts to compare distinct items, like the performance of different ad campaigns or marketing channels.
- Utilize pie charts sparingly. They only really work when you’re showing parts of a whole with a few, very different-sized segments.
Finally, dedicate sections to breaking down performance by each marketing channel (SEO, PPC, email, etc.). This is where you get tactical. Providing this granular view empowers your team to see what’s working, spot what isn't, and make smart, quick adjustments to their strategies.
How to Measure Your Marketing ROI
Let's be honest: measuring marketing Return on Investment (ROI) can feel like trying to nail Jell-O to a wall. The customer journey isn't a straight line from A to B. It's a winding, unpredictable path, which makes it incredibly tough to draw a direct line from one of your marketing activities to a final sale.
You're dealing with fragmented data from a dozen different platforms and sales cycles that can stretch for months. Was it the blog post they read last week, the social ad they saw yesterday, or the email they just opened that finally convinced them to buy? Figuring this out is the core challenge, and it's why proving the financial impact of your work is so critical.
The Challenge of Modern Attribution
The hard truth about marketing analytics is that perfect, one-to-one attribution is mostly a myth. A customer might see your ad on Monday, read a product review on Wednesday, and finally click a link in your newsletter on Friday to make a purchase. If you give 100% of the credit to that final email click, you're ignoring the entire journey that led them there.
This isn't a niche problem; it's an industry-wide headache. The 2025 Marketing Data Report from Supermetrics found that 41% of marketers feel they can't effectively measure marketing outcomes across their different channels. And yet, 63% of those same marketers say ROI is their most important metric. We all know it’s vital, but most of us are struggling to prove it.
This is why the sharpest companies are moving past simplistic "last-touch" models and digging into more sophisticated ways of understanding performance.
Advanced Techniques for a Clearer Picture
To get past the noise of messy, disconnected data, savvy marketers are embracing models that give a much more complete view of performance. These methods don't just focus on the final click; they analyze how your entire marketing ecosystem works together.
Two powerful techniques are really gaining ground:
- Marketing Mix Modeling (MMM): Think of this as a high-level statistical analysis. It helps you figure out how much each of your channels—from TV ads to Google searches—is actually contributing to your bottom line. It's the key to making smarter budget allocation decisions.
- Incrementality Testing: This is all about proving cause and effect. You run controlled experiments (like showing an ad to one group but not another) to measure the "lift"—the sales you generated that absolutely would not have happened without that specific ad.
This infographic does a great job of breaking down how to structure a report, moving from a big-picture summary down to the nitty-gritty details.
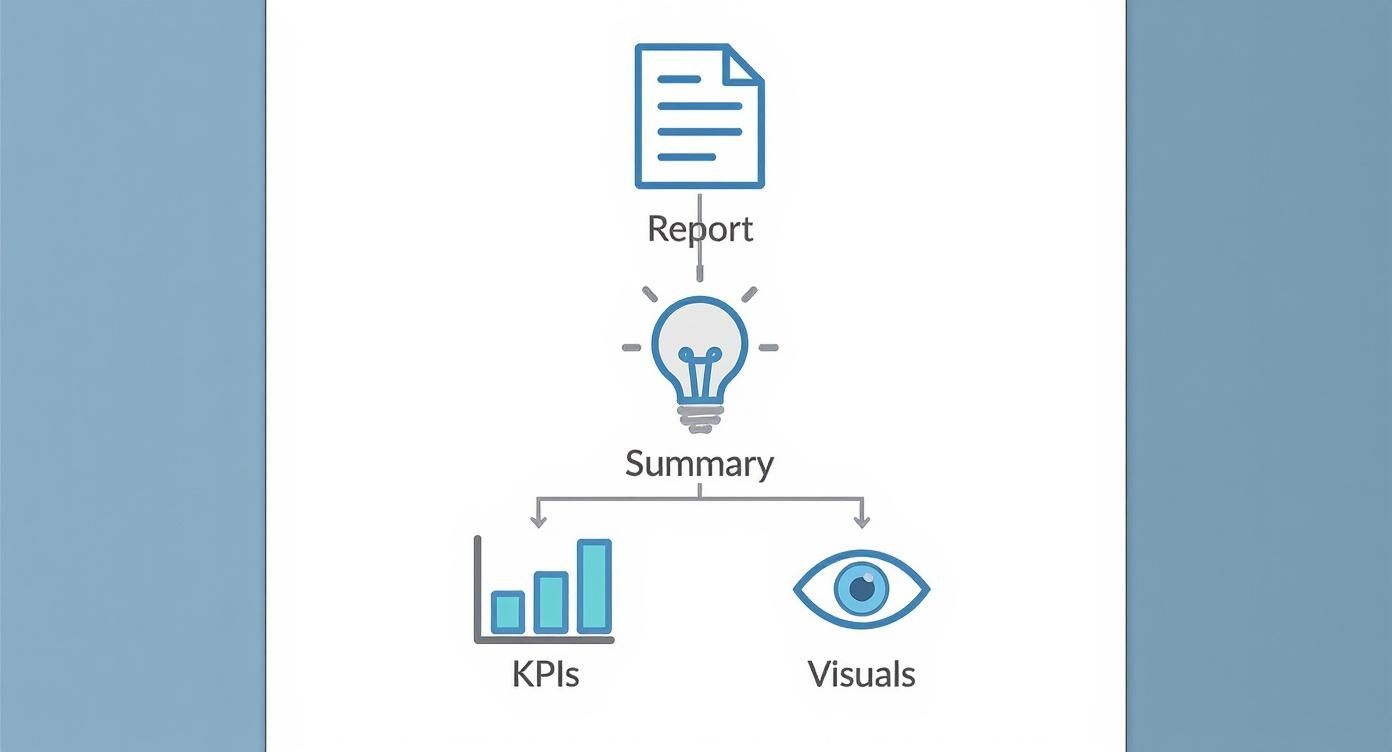
As you can see, a solid report always starts with a clear, concise summary before diving into the specific metrics and charts that back it up.
Practical Steps for Any Team
While fancy models are great, you don't need a data science degree to get a better handle on your impact. Any team, regardless of size or budget, can take real, practical steps to connect their work to business outcomes.
Measuring ROI isn't just about justifying your budget. It's about understanding what truly moves the needle for your business, transforming marketing from a cost center into a predictable engine for growth.
Start by setting up clear conversion goals in your analytics tools. Don't just track the final sale; look at micro-conversions like demo requests or newsletter sign-ups. It's also incredibly helpful to automate ad ops tasks and calculate ROI, as this frees up your time and leads to more accurate data.
Finally, your numbers need context. It’s crucial to see how your metrics stack up against the competition. Using a framework for https://champsignal.com/blog/competitive-benchmarking helps you set realistic goals and spot opportunities to pull ahead. When you connect your marketing activities to both your company's financial goals and the broader market, you build an undeniable case for your team's value.
How AI Is Reshaping Modern Reporting
Let's be honest, for years, marketing reporting meant staring at endless spreadsheets and static dashboards, trying to piece together a story from the numbers. It was a manual, often tedious process. But artificial intelligence isn't just a buzzword from a sci-fi movie anymore; it's a real-world tool that's completely changing the game.
AI is essentially automating all that heavy lifting. Instead of just looking backward at what happened last quarter, we can now start making educated guesses about what's coming next. Think of it as having a super-fast analyst who can sift through millions of data points in seconds, spot patterns you'd never see, and then explain what it all means in simple terms. It turns raw, messy data into genuine strategic insight.
From Manual Drudgery to Automated Insights
The most obvious win with AI is how it automates the soul-crushing tasks of pulling and cleaning data. No more spending the first Monday of every month exporting reports from Google Analytics, your CRM, social media platforms, and ad accounts. AI-powered tools connect these sources and do it all for you, freeing you up to think about strategy and creativity.
But that's just the beginning. The real power move is what AI does after the data is gathered. Algorithms can now run complex analyses that used to require a dedicated data scientist.
For instance, these systems can automatically:
- Spot Anomalies: Get a real-time alert when something is off—like a sudden drop in website traffic or a weird spike in conversions—so you can investigate immediately.
- Write Summaries for You: Many modern tools use natural language generation to create plain-English summaries of your reports, highlighting the key takeaways just like a human would.
- Find Hidden Connections: AI can uncover correlations you’d never dream of looking for. Did you know that rainy weather in Chicago is tanking your local ad campaign? An AI might.
Predictive Analytics: The New Frontier
This is where things get really exciting. The most powerful application of AI in reporting today is predictive analytics. Traditional reports tell you what happened. Predictive models use all that historical data to forecast what's likely to happen. It’s like having a crystal ball, but one that’s grounded in actual data science.
An AI model could, for example, look at your past campaigns and predict the probable ROI for a new one you’re planning. Or it could identify which customers are showing signs of churning, giving you a chance to step in and save the relationship. This flips reporting on its head—it’s no longer a reactive chore but a proactive tool for driving growth. To get a bigger picture of how this will evolve, it's worth exploring the potential of AI in business and its wider impact by 2025.
The Real-World Business Impact of AI
This isn't just theory; AI is delivering tangible results right now. The numbers don't lie: 63% of marketers are already using generative AI, and the market for it is expected to hit $22 billion by 2032. The connection to the bottom line is clear, too, with 83% of sales teams using AI reporting revenue growth. You can dive deeper into these figures in the full marketing statistics report.
This data shows just how quickly AI is becoming standard practice. The companies jumping on board aren't just getting more efficient; they're actively making more money because of it.
AI empowers marketing teams to move at the speed of the market. By automating analysis and predicting trends, it allows us to make smarter decisions faster, turning data into a true competitive advantage.
Of course, with great power comes great responsibility. As we weave AI deeper into our work, we have to be mindful of the ethics involved. That means being transparent with customers about how their data is used and working to eliminate bias from our algorithms. Building trust is non-negotiable. At the end of the day, AI is a powerful assistant, here to augment human expertise, not replace it.
Reporting on Your Personalization Strategy
Customers today have zero patience for generic marketing. They expect you to know who they are, what they want, and when they want it. As personalization becomes the standard, our marketing reporting has to keep up. The old-school campaign metrics are still part of the picture, but they don't tell the whole story of how tailored experiences build lasting customer relationships.
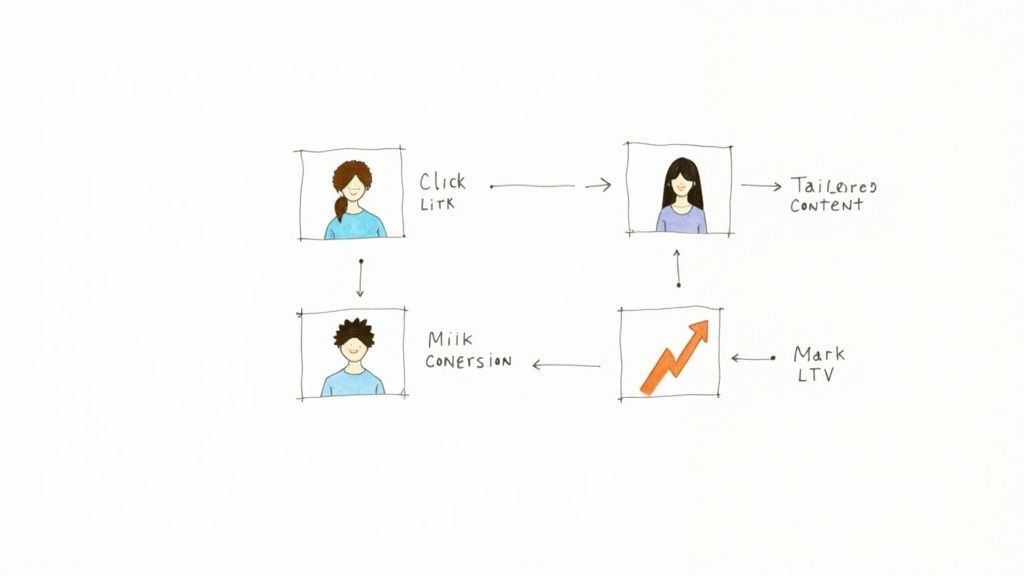
Reporting on personalization is all about shifting your focus from broad, campaign-level numbers to customer-centric outcomes. Think of it as switching from a wide-angle lens that captures the entire crowd to a zoom lens that focuses on individual faces. You start measuring the real impact of delivering the right message to the right person at the perfect moment.
This approach proves you see your audience not as a faceless mob, but as a collection of individuals with their own unique needs and preferences.
Moving Beyond Generic Campaign Metrics
Traditional reports live and die by campaign-level data—things like overall click-through rates or total leads generated. While useful, these metrics completely miss the specific impact of your personalization efforts. To measure what’s really working, you need to track KPIs that reflect how individual customer journeys are playing out.
Let’s put it this way: if you blast a generic email to 10,000 people, your main success metric is a simple 2% conversion rate. But what if you send 10,000 different, personalized emails to those same people? Your reporting now needs to show how those tailored messages performed across dozens of different audience segments. That's a whole different ballgame.
This is exactly why personalization is such a powerful driver of marketing success. Research from Deloitte Digital shows that companies laser-focused on personalization are far more likely to smash their revenue goals. It’s no surprise that nearly 56% of marketing leaders are investing heavily in the right tech, reshaping their reporting to prioritize these customer-centric metrics.
Key Metrics for Your Personalization Reports
To build a report that truly shows off the power of your personalization strategy, you need to be tracking a different set of KPIs. These are the metrics that connect your tailored efforts directly to customer behavior and, ultimately, to the bottom line.
Here are the essentials to include:
- Segment-Specific Conversion Rates: Forget about your overall conversion rate for a minute. How did the conversion rate look for each specific audience segment that received a personalized offer? This is where you find out which groups are responding best.
- Engagement with Personalized Content: Go deeper than just clicks. Track how users interact with dynamic content blocks, custom product recommendations, or tailored calls-to-action. Are they actually clicking on those AI-powered recommendations? This proves your personalization engine is doing its job.
- Customer Lifetime Value (CLV) by Segment: Are your personalized experiences leading to higher CLV for certain customer groups? A rising CLV in a targeted segment is a massive win and a clear sign of success.
- Uplift from Personalization: This is your golden metric. Run A/B tests comparing a personalized experience against a generic control version. The difference in performance—the "uplift"—is the most direct way to prove the ROI of your efforts.
Effective personalization reporting answers a simple but powerful question: Are we creating more value for our customers by treating them as individuals? If the answer is yes, the data will prove it.
By folding these metrics into your reports, you turn them into a powerful tool for proving that understanding your customer isn’t just a nice-to-have—it’s a core driver of revenue and loyalty. This kind of granular insight lets you fine-tune your strategy, optimize every campaign, and make a rock-solid case for continued investment in personalization.
Building Your Marketing Reporting Workflow
https://www.youtube.com/embed/Y-lmPvmBT3s
A great marketing report isn't just a document; it's the final piece of a carefully constructed process. If you don't have a consistent, repeatable system in place, reporting can quickly turn into a frantic, last-minute fire drill that delivers confusing results. A solid workflow turns that monthly headache into a genuine strategic advantage.
Think of it like an assembly line. Each step is clearly defined, and everyone knows their role. You don't just throw parts together and hope for the best. You start with a plan—a clear understanding of your goals, defined with your key stakeholders. This initial conversation is critical; it ensures you’re measuring what actually drives the business forward, not just tracking vanity metrics.
Once you know what you're aiming for, you need to figure out where your data lives. It's rarely in one convenient place. You'll likely need to pull information from Google Analytics, your CRM, various social media platforms, and your ad networks. The first part of any good workflow is simply mapping out these sources and figuring out a reliable way to get the data out.
Designing an Efficient Process
With your goals set and data sources mapped, you can start building the actual workflow. The whole point is to create a process that’s logical, repeatable, and automated wherever possible. This is how you guarantee every report is accurate and tied directly back to your objectives.
A typical reporting workflow moves through a few key stages:
- Data Collection: This is the gathering phase. You’re pulling all the metrics you need from your different platforms. Automation tools are your best friend here—they can pull data on a schedule, which saves a ton of time and cuts down on human error.
- Data Integration and Cleaning: Raw data is almost always messy. This step is about getting all that information into one place (like a spreadsheet or a dashboard) and cleaning it up. That means standardizing formats, removing duplicates, and ensuring everything is accurate before you start analyzing.
- Analysis and Insight Generation: Now for the fun part. With clean data, you can move beyond just listing numbers and start digging for the "why." You’re looking for trends, spotting patterns, and uncovering the actionable insights that no one else has seen.
- Visualization and Presentation: Finally, you need to package your findings in a way that people can actually understand. This involves creating simple, intuitive charts and graphs and adding commentary that tells a compelling story and guides the next steps.
Choosing Your Toolkit and Cadence
The right tools can make or break your workflow. While a simple spreadsheet might work when you're just starting out, dedicated dashboarding and business intelligence tools offer far more power, automation, and visualization options. Picking the right one requires a good look at the features. For a detailed breakdown, exploring a business intelligence tools comparison can help you find the best fit for your team's needs and budget.
A great reporting workflow isn't about creating more reports; it's about creating more clarity. It standardizes how you measure success, making your data more reliable and your insights more powerful over time.
Lastly, set a reporting cadence that makes sense for your audience. Your campaign managers might need a quick look at performance every week to make tactical tweaks. The leadership team, on the other hand, might only need a high-level review once a quarter. Nailing down this rhythm ensures the right information gets to the right people at the right time, making your reports a true cornerstone of your growth strategy.
Your Top Marketing Reporting Questions, Answered
Even with the best plan in place, you’re bound to have questions once you start building reports. This section is your go-to reference for some of the most common hurdles marketers face. Getting these details right from the beginning will make your entire process smoother and more effective.
We'll walk through three things that trip up even seasoned pros: how often to report, what tools to use, and how to talk about your data with people who aren't marketers.
How Often Should I Create Marketing Reports?
There’s no one-size-fits-all answer here. The right reporting schedule really comes down to who’s reading the report and what they plan to do with the information. Sending the wrong level of detail at the wrong time is a surefire way to get your reports ignored.
A simple way to think about it is to match the frequency to the role:
- Weekly: This is for the practitioners—the campaign managers and specialists on the front lines. They need this near-real-time data to tweak ad spend, adjust content, and make quick decisions that optimize performance on the fly.
- Monthly: Perfect for marketing managers. A monthly view is high-level enough to see channel trends and track progress toward quarterly goals, but detailed enough to spot problems before they become massive issues.
- Quarterly: This is for the C-suite and leadership. These reports zoom all the way out to focus on the big picture: marketing’s overall impact on revenue, ROI, and how our efforts are pushing major business objectives forward.
What Are the Best Tools for Marketing Reporting?
The "best" tool really depends on your budget, your team's technical skills, and how complex your marketing efforts are. If you're just getting started, you don't need to break the bank. The native analytics inside platforms you already use, like Google Analytics or your social media accounts, are packed with valuable data and are completely free.
When you're ready to level up, you'll want something that can pull all your data together. That’s where data visualization tools like Looker Studio, Tableau, or Power BI come in. They let you build custom, interactive dashboards that tell a much more complete story.
For an even more streamlined approach, all-in-one platforms like HubSpot keep your marketing execution and reporting under one roof. And to cut down on manual data entry, tools like Supermetrics can automatically pipe data from all your sources into one place.
How Do I Present Marketing Data to Non-Marketers?
When you’re sharing your results with the sales team, finance, or executives, your most important job is to act as a translator. Leave the marketing-speak at the door. Your goal is to tell a clear, simple story about business impact.
The key is to lead with the "so what?" Your audience doesn't care about the nitty-gritty metrics; they care about what those metrics mean for the business. Tie everything back to what they care about: revenue, new customers, and market position.
Instead of saying, "Our click-through rate jumped by 15%," reframe it for them. Try this: "Because we improved our ad creative, we generated 50 more qualified leads for the sales team this month." Use simple visuals, focus on the bottom line, and you’ll successfully connect the dots between your marketing work and the company's success.
Ready to stop guessing what your competitors are doing? ChampSignal delivers high-signal alerts on competitor website changes, ad strategies, and SEO moves directly to your inbox. Find out more at https://champsignal.com.
Stay Ahead
Don't just find competitors. Stay ahead of them.
Auto-discover new competitors in your market. Get alerts when they change pricing, features, emails, ads, or messaging.
Stay ahead without the tracking busywork.
See competitor pages, emails, social posts, ads, and SEO signals in one place.
What ChampSignal watches for you
The channels competitors own, the places people talk about them, and the alerts that matter when something changes.
Website & Email Monitoring
Page updates, pricing changes, messaging shifts, and competitor newsletters.
Social Monitoring
X posts, Reddit threads, and other public social chatter.
Ads Monitoring
Ad copy, creatives, and landing pages across Google and Meta.
SEO Monitoring
Keywords, backlinks, and ranking shifts tied to competitor pages.
Auto Competitor Discovery
New rivals surfaced before they show up in deals or search.
High-Signal Alerts
The few alerts and digests that matter, delivered by email or Slack.