Master client reporting: Elevate Your Reports

Maxime Dupré
11/4/2025

Client reporting is so much more than just sending a monthly update. Done right, it's how you communicate progress, share critical insights, and tell the story of your impact. It’s about building a narrative around the data that proves the value of your work and cements the client relationship for the long haul. This is your moment to prove ROI and build unshakeable trust.
Moving Beyond Outdated Client Reporting
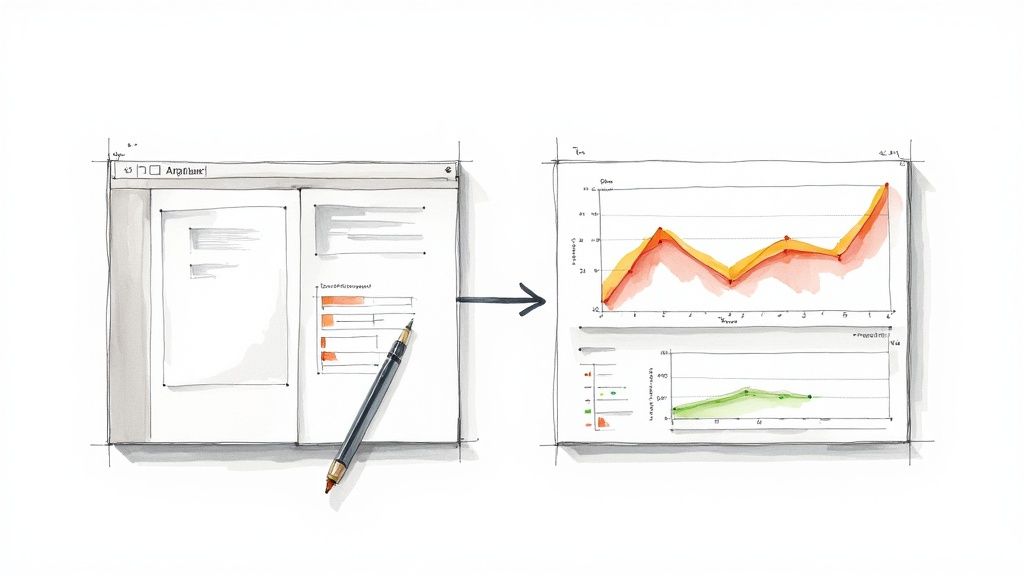
Let’s be honest, traditional client reporting is often a soul-crushing chore. It’s hours spent pulling numbers from a dozen different platforms, wrestling with spreadsheets, and creating static PDFs that, if we're lucky, get a quick skim. These reports end up being a backward-glancing administrative task instead of a forward-looking strategic tool.
This old way of doing things creates a huge disconnect. Your team sinks valuable time into low-impact grunt work, while your clients are left staring at a wall of numbers, wondering how any of it connects to their actual business goals. The result is a massive missed opportunity to reinforce your value and map out the future together.
The Shift to Strategic Communication
Smart agencies are completely flipping the script. They see client reporting not as a box to check, but as the bedrock of their client retention strategy. The focus is no longer on just presenting data—it's about telling a compelling story of progress and proving undeniable ROI. It's about turning those data dumps into dynamic, insightful conversations.
This isn't just an agency trend; it's a fundamental shift. For instance, a recent survey revealed that 92% of asset managers are making the digital overhaul of their client reporting a top priority. They recognize it's a critical part of keeping clients engaged, even if internal hurdles slow them down. It shows a clear gap between wanting to be better and actually doing it.
The goal is to make every report an indispensable strategic asset. It should answer not just "What happened?" but "Why did it happen, and what should we do next?" This proactive stance turns your agency from a service provider into an invaluable partner.
To see just how much has changed, let's break down the evolution from the old way to the new.
The Evolution of Client Reporting
This table highlights the shift from a reactive, administrative task to a proactive, strategic partnership.
| Characteristic | Traditional Reporting | Modern Reporting |
|---|---|---|
| Focus | Backward-looking data delivery | Forward-looking strategic insights |
| Format | Static PDFs, dense spreadsheets | Interactive dashboards, live data |
| Frequency | Rigid monthly or quarterly dumps | Real-time alerts & on-demand access |
| Narrative | Data-heavy, little context | Story-driven, focused on ROI |
| Client Role | Passive recipient | Active collaborator |
| Goal | Fulfill a contractual obligation | Strengthen the relationship & inform strategy |
The difference is night and day. Modern reporting isn't about just showing the work; it's about building a shared understanding of what's working and where to go next.
To truly leave outdated methods behind, it’s worth exploring modern business intelligence reporting solutions that can automate the tedious parts of data collection and visualization. A great place to start is by getting a feel for the landscape; our https://champsignal.com/blog/business-intelligence-tools-comparison can help you find the right platform for your needs.
Choosing KPIs That Actually Matter to Clients
The best client reporting doesn't start with a fancy dashboard or a complicated spreadsheet. It starts with one simple question: "If we could improve just one metric, which one would fundamentally change your business?"
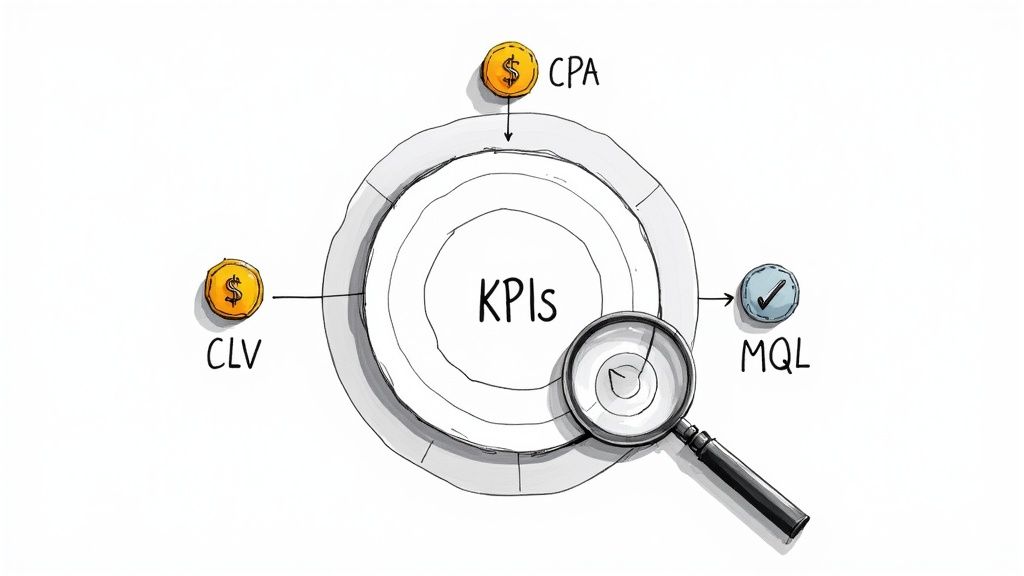
Getting past vanity metrics like raw website traffic is the first real step toward becoming a strategic partner. Anyone can report on clicks; a true partner reports on impact.
I remember an e-commerce client who was absolutely fixated on their daily visitor count. We gently shifted the conversation to Customer Lifetime Value (CLV) and Cost Per Acquisition (CPA). That small change transformed their entire marketing strategy. Suddenly, the goal wasn't just getting more traffic—it was about attracting profitable customers who would come back again and again.
Match Your Metrics to the Business Model
Every business is different, so why would their KPIs be the same? Reporting on Marketing Qualified Leads (MQLs) makes perfect sense for a B2B SaaS company, but it’s completely useless for a local restaurant trying to get more people in the door.
Your job is to draw a straight line from your work to their revenue. When you do that, your report stops being an update and becomes an indispensable business intelligence tool.
Here’s how this looks in the real world:
- For an E-commerce Store: Forget just reporting sales. Focus on Average Order Value (AOV), cart abandonment rate, and customer acquisition cost. These metrics tell the real story of profitability.
- For a B2B SaaS Company: You should be tracking MQLs, sure, but also sales pipeline velocity and churn rate. These KPIs are the lifeblood of their sales funnel and long-term health.
- For a Service-Based Business: The game is about lead conversion rates, cost per qualified lead, and client satisfaction scores. Want to get really good at that last one? This A Practical Guide to Measuring Customer Satisfaction has some solid strategies.
The data itself is just noise. The real value is in the story it tells about the client's business. When you start reporting on metrics that tie directly to revenue and growth, you’re speaking a language every stakeholder actually cares about.
Look Outside Their Four Walls with Competitive Signals
Your client doesn’t exist in a bubble, and your reporting shouldn’t either. The most valuable reports I've ever built included data from outside the client's own analytics. This is where you graduate from service provider to strategic advisor.
Watching what competitors are doing adds crucial context. It helps you answer tough questions like, "Did our performance dip because our strategy is off, or did a competitor just launch an aggressive new campaign?" That kind of insight is pure gold.
Start weaving these external signals into your reporting:
- Competitor Ad Creative: Are rivals testing new messaging? Are they running a huge promotion? Knowing this helps you understand their strategy and anticipate their next move.
- Backlink Profile Changes: If a competitor suddenly gets a wave of high-authority backlinks, it’s a huge red flag. It probably means a big PR push or a killer piece of content you need to analyze.
- Brand Mentions: Keep an ear to the ground on places like Reddit or industry forums. You'll find unfiltered customer feedback about your client and their rivals.
Adding this layer of market intelligence takes your reporting to a whole new level. To really get into the weeds on this, our guide on competitive benchmarking walks through the process step-by-step. It’s how you turn a simple report into a true competitive weapon for your client.
Building a Report Template That Actually Works
A solid report template is your secret weapon. It’s not just about saving a few hours each month; it’s about creating a consistent, professional experience that builds client trust over time. When every report looks and feels different, it creates confusion and makes your agency look disorganized.
The goal is to build a foundational structure that’s rigid enough to provide consistency but flexible enough to adapt to each client's unique goals. This ensures every report, no matter who on your team creates it, tells a clear story of the value you're delivering.
Tell a Story, Don't Just Dump Data
Your report template needs a narrative flow. Think of it like a story with a beginning, a middle, and an end. This simple structure makes complex data digestible and prevents clients from feeling like they’re staring at a spreadsheet.
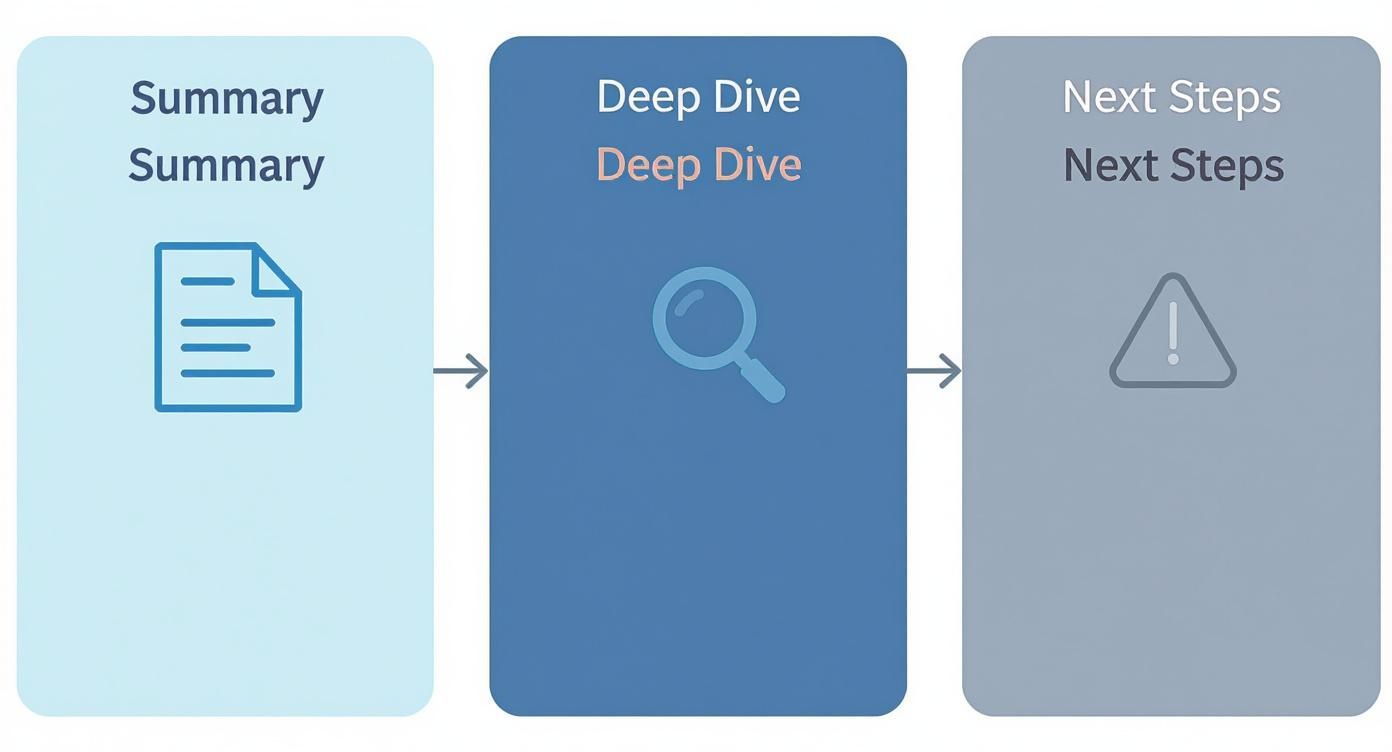
Always kick things off with a punchy executive summary. This is, without a doubt, the most important part of the entire report. Busy executives and clients need the highlights in 60 seconds or less. A few bullet points covering the big wins, key challenges, and what it all means is perfect.
From that high-level overview, guide them through the details logically:
- KPI Deep Dives: Create dedicated sections for each core goal. If it's about generating leads, walk them through the entire funnel. Don’t just show charts; explain the why behind the numbers.
- Insights & Observations: This is where your expertise shines. Connect the dots for them. Instead of just stating a fact, offer an interpretation, like, "We saw a 15% drop in conversions immediately after the website update. Our hypothesis is that the new checkout flow is causing friction."
- What's Next? Wrap it all up with a clear, actionable plan. Outline exactly what your team is focusing on next, what you need from the client, and the outcomes you’re aiming for.
A great report template isn't a rearview mirror; it's a roadmap. It should spark a strategic conversation about what to do next, turning a routine task into a valuable planning session.
Making Your Reports Look the Part
Let's be honest: tables full of raw numbers are a snoozefest. They’re also incredibly hard to understand at a glance. Visuals are your best friend here. The human brain processes images 60,000 times faster than text, so lean into that.
Use simple, clean charts. A line graph is perfect for showing a trend over time, a bar chart works great for comparing different channels, and a pie chart can quickly show the breakdown of your traffic sources. The goal is instant clarity, not a lesson in advanced data science.
Finally, don't forget the branding. Pop the client’s logo and brand colors into the template. This small touch makes the report feel like a custom-built document just for them and positions you as a true partner, not just another vendor. It's a simple way to elevate the experience, which is more important than ever. In fact, The 2025 Forrester Global Customer Experience Index revealed that 25% of U.S. brands saw their CX scores drop for the second year in a row, highlighting just how tough it is to consistently deliver value. You can dig deeper into the full Forrester CX Index findings.
Automating Your Reporting for Speed and Accuracy
Let's be honest: manual data entry is a soul-crushing time sink. It’s also an open invitation for errors and the single biggest bottleneck in most agencies' reporting workflows. This is where you can reclaim dozens of hours every single month. By letting technology do the heavy lifting, your team can finally stop copy-pasting numbers and start focusing on strategy and uncovering real insights.
The goal here isn't just to make your life easier. It's about delivering more accurate, timely, and valuable information to your clients. Static, month-old reports are quickly becoming a relic. The future is interactive dashboards that spark better conversations and reveal much more meaningful insights. You can read more about what we call the agency reporting revolution at sevenfigureagency.com.
Connecting Your Data Sources
The real magic happens when you hook your reporting tools directly into your data sources. Think of platforms like Looker Studio, DashThis, or Supermetrics as central hubs. They automatically pull in data from all the places you're already working, creating one unified view of performance.
This means you can pipe in data from all over the place:
- Website Analytics: Data from Google Analytics or Adobe Analytics covering traffic, conversions, and user behavior flows right into your dashboards.
- Advertising Platforms: Connect your Google Ads, Meta Ads, and LinkedIn Ads accounts to automatically pull spend, impressions, clicks, and CPA.
- SEO Tools: Integrate with tools like SEMrush, Ahrefs, or Moz to track keyword rankings, backlink growth, and site health without ever hitting "export to CSV" again.
Once you set up these connections, you’ve eliminated the daily grind of logging into ten different platforms and manually compiling spreadsheets. That’s where most of the mistakes happen anyway.
This screenshot from Looker Studio is a perfect example of how clean it can be. It pulls from multiple sources and presents everything in one clear, visual interface.
This visual approach is a lifesaver for clients. They can grasp key trends at a glance without getting bogged down in endless rows of numbers.
From Static PDFs to Live Dashboards
The biggest and best shift that automation brings is the move away from static monthly PDFs to live, interactive dashboards. Instead of sending a report that’s outdated the moment you hit "send," you give your clients a link where they can check performance anytime. This alone builds a massive amount of transparency and confidence.
A live dashboard completely changes the client conversation. It goes from, "What happened last month?" to "What's happening right now, and what are we doing about it tomorrow?" It turns reporting from a historical document into a real-time strategic tool.
Setting Up Proactive Alerts
Automation isn't just for pulling data for your monthly reports; it’s also for staying on top of things day-to-day. The best tools let you configure automated alerts that fire off whenever there’s a significant performance shift. For client management, this is an absolute game-changer.
You can set up custom alerts for all sorts of triggers:
- Sudden Ranking Drops: Get an instant email if a money keyword falls off the first page of Google.
- Unusual Ad Spend: Receive a notification if daily ad spend suddenly spikes, which can save a client's budget from being accidentally blown.
- Traffic Anomalies: Be alerted to a sharp, unexplained dip in website traffic that could point to a broken page or a server issue.
These alerts help you get out in front of problems. Instead of waiting for a client to discover an issue and ask you what’s going on, you can reach out proactively with an explanation and a plan. For a deeper look at this, our guide on competitive tracking and alerts is a great resource. This kind of proactive management shows you’re not just watching the numbers—you’re actively protecting their business.
Proving the Value of Your New Reporting Process

So, you've rolled out a sleek, automated client reporting system. That's a huge step, but the job isn't done. Now you have to prove it was worth the effort. The real proof isn't just about the hours your team gets back; it's about seeing a tangible, positive change in your client relationships and, ultimately, your agency's health.
The first clues that you're on the right track are often felt before they're measured. You’ll start to notice a different vibe in your client meetings. Instead of spending the first half of the call explaining what the data means, you're jumping right into what to do about it.
Shifting from Clarification to Strategy
You know you've nailed it when the questions change. When clients stop asking, "What does this number mean?" and start asking, "How can we get this number to go up?"—that's the moment of truth. This shift is one of the most powerful indicators that your reports are delivering genuine insight, not just a jumble of data points.
This transition is exactly what we're aiming for. It elevates your agency from a service provider that reports on the past to a strategic partner actively shaping the future.
When your reports spark more ideas than questions, you've successfully transformed them from a simple deliverable into a catalyst for client growth. That’s the true return on investment.
Tracking the Quantitative Impact
While the feel of the meetings is important, you'll also need some hard numbers to back it up. These metrics give you concrete evidence that your new process is directly benefiting both your clients and your own bottom line.
Start tracking a few key performance indicators to see the real-world impact of your improved reporting:
- Client Retention Rate: This is the big one. Happy, well-informed clients stick around. It’s as simple as that. Track your churn rate before and after the new system was implemented; the difference should be telling.
- Upsell and Cross-Sell Opportunities: Good reports don't just recap what happened; they highlight what's next. When a conversation sparked by a dashboard leads to an expanded scope or a new project, that's a direct win you can credit to better reporting.
- Dashboard Engagement Metrics: For those using live dashboards, keep an eye on how often clients are logging in. Consistent, high engagement means they see it as a critical tool for running their business, not just another report to file away.
These data points provide the undeniable proof that a solid client reporting strategy is far more than an operational tweak—it's a powerful engine for business growth.
Your Client Reporting Questions Answered
Even with the best strategy in place, switching up your client reporting can feel like a massive project. It's totally normal to have questions about how to actually pull it off. Let’s walk through some of the most common sticking points we see agencies run into.
Here’s a quick rundown of the big questions.
| Question | Answer |
|---|---|
| How do I get clients on board with a new dashboard? | Frame it as a benefit for them—real-time access and deeper insights. Run it alongside your old reports for a month or two, and use your calls to show them how powerful the live data can be. |
| What's the right reporting schedule? | It depends on the client, but the best approach is a hybrid model: 24/7 live dashboard access, automated alerts for big events, and scheduled monthly or quarterly strategy calls. |
| Can we charge more for better reporting? | Absolutely. You can tier your services. A standard package might include a basic dashboard, while a premium offering provides competitive intelligence, deeper analysis, and more frequent strategic guidance. |
Now, let's dive a little deeper into each of these.
How Do We Get Clients to Adopt a New Dashboard?
The trick here is to make the change all about them. Don't start the conversation by explaining how much time this new dashboard saves your team. Instead, focus on how it gives them unprecedented, real-time access to the data that matters most to their business.
A great way to manage this is to run the new dashboard in parallel with your old PDF reports for a month or two. This gives them a chance to get comfortable without feeling like you've just pulled the rug out from under them.
During your weekly or monthly calls, make the dashboard the star of the show. Walk them through it live. Show them how they can now dig into data points that were completely hidden before. The goal is to demonstrate that it's a tool for their empowerment, not just another report to file away.
When clients start logging into the dashboard themselves to find answers before they email you, you'll know you’ve won. You want them to see it as their go-to source of truth, making the old static report feel obsolete.
What’s the Best Reporting Cadence?
This is the classic "it depends" question, but here’s a solid rule of thumb: match the reporting cadence to the client’s speed of business. A fast-moving e-commerce brand might need weekly check-ins and will live in their dashboard daily. On the other hand, a B2B company with a six-month sales cycle is probably fine with a formal review once a month.
But the modern way of thinking goes beyond one single, rigid schedule. The best setup is actually a hybrid model that combines a few different things:
- Live Dashboard Access: Always on, 24/7, for any client who wants to check in on their own time.
- Automated Alerts: These are your tripwires. Set them up for critical events, like a sudden drop in conversions or a spike in ad spend, so you and the client know immediately.
- Scheduled Deep Dives: This is your dedicated strategy time. Use monthly or quarterly calls to zoom out, discuss the bigger picture, and plan the next moves.
This approach gives you the best of both worlds—constant transparency for the client and protected time for you to have meaningful strategic conversations.
Should We Charge Extra for Advanced Reporting?
Yes, you absolutely should. This is a perfect opportunity to create different service tiers. Think about it—your standard package could include a solid dashboard covering the basics. But a premium tier? That’s where you can offer the really juicy stuff.
This could include more in-depth analytics, tracking competitor moves, or providing more frequent one-on-one strategy sessions.
Here’s how I’ve seen it structured successfully: Basic reporting shows what happened. Advanced reporting explains why it happened and what you should do about it. That extra layer of analysis and strategic guidance is a seriously valuable service, and most clients who are serious about growth are happy to pay for it.
Ready to stop guessing what your competitors are doing? ChampSignal gives you high-signal alerts on their pricing, SEO, and advertising moves so you can react faster and smarter. Stop the manual research and start getting actionable insights today. Explore ChampSignal.
Stay Ahead
Don't just find competitors. Stay ahead of them.
Auto-discover new competitors in your market. Get alerts when they change pricing, features, emails, ads, or messaging.
Stay ahead without the tracking busywork.
See competitor pages, emails, social posts, ads, and SEO signals in one place.
What ChampSignal watches for you
The channels competitors own, the places people talk about them, and the alerts that matter when something changes.
Website & Email Monitoring
Page updates, pricing changes, messaging shifts, and competitor newsletters.
Social Monitoring
X posts, Reddit threads, and other public social chatter.
Ads Monitoring
Ad copy, creatives, and landing pages across Google and Meta.
SEO Monitoring
Keywords, backlinks, and ranking shifts tied to competitor pages.
Auto Competitor Discovery
New rivals surfaced before they show up in deals or search.
High-Signal Alerts
The few alerts and digests that matter, delivered by email or Slack.