A Guide to Calculating Share of Voice

Maxime Dupré
11/20/2025
Let's be real for a moment. The textbook formula for Share of Voice is straightforward: take your brand's metric, divide it by the total market metric, and multiply by 100. But knowing the formula is one thing; understanding what it truly tells you about your brand's health and competitive standing is another entirely.
What Share of Voice Really Tells You About Your Brand
At its core, Share of Voice (SOV) is your brand's piece of the pie—your slice of the conversation within your market, measured right up against your competitors. Think of it less as a simple percentage and more as a leading indicator of where your market share is likely to go. A rising SOV today often signals market share growth tomorrow. It’s that important.
The concept isn't new, but its application has changed dramatically. What started as a simple way to compare advertising budgets has evolved into a much richer, multi-channel metric. If you're not tracking your visibility across the entire competitive landscape, you're flying blind.
An Updated Take on SOV
Today, a smart SOV analysis has to look beyond just who has the deepest pockets for advertising. It requires a holistic view of your visibility across the digital spaces where your customers actually are.
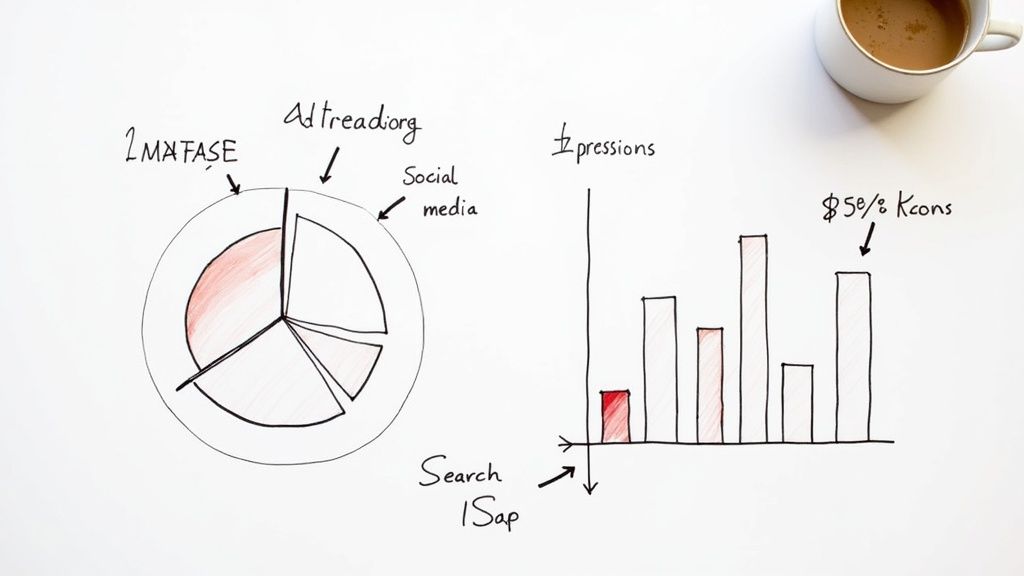
This means you need to be measuring:
- Social Media: How often are people talking about you? Are they using your hashtags? What's the sentiment?
- Organic Search: When someone searches for a key term in your industry, do you show up on the first page, or does your competitor?
- Public Relations: Are you getting mentioned in major online publications and news outlets?
- Paid Advertising: What’s your impression share? How does your ad spend stack up against others in your niche?
Let’s imagine two e-commerce brands gearing up for the holiday rush. Brand A throws a massive budget at display ads, so their logo is everywhere. Brand B, with a leaner budget, focuses on dominating the social media conversation around "unique holiday gifts" and secures the top organic search rankings for those terms.
While Brand A has a huge SOV in paid media, Brand B’s powerful presence in organic search and social media is likely driving more high-intent traffic and, ultimately, more sales. It's a classic case of working smarter, not just louder. It's not about who shouts the most, but about who is heard by the right people, in the right places.
Share of Voice is a key competitive measurement in advertising, representing the percentage of a company's advertising spend relative to the total market expenditure for a product or category. For example, if a company invests $5 million in advertising a device, while the total market advertising spend is $100 million, the company holds a 5% SOV. This calculation is straightforward: divide the brand's advertising spend by the total category spend and multiply by 100. You can find more on the history of this foundational metric over on Wikipedia.
To help you get a clearer picture of what to track, here's a quick breakdown of the key metrics used across different channels.
Key SOV Metrics Across Different Channels
| Channel | Primary Metric for SOV Calculation | Example Data Source |
|---|---|---|
| Organic Search | Keyword Rankings / SERP Visibility | SEO platforms (e.g., Ahrefs, Semrush) |
| Paid Search | Impression Share | Google Ads, Microsoft Advertising |
| Social Media | Brand Mentions / Hashtag Usage | Social listening tools (e.g., Brandwatch) |
| Public Relations | Media Mentions / Earned Media Value | Media monitoring services (e.g., Cision) |
| Paid Social | Ad Impressions / Reach | Native platform analytics (e.g., Facebook Ads) |
This table serves as a good starting point for identifying the data you need to pull together a comprehensive SOV report.
Ultimately, SOV is far more than a vanity metric to show off in a meeting. It’s a powerful strategic tool. When you measure it consistently, you can start to deconstruct competitor strategies, spot untapped channels, and make a much stronger case for your marketing investments. It gives you the critical context to prove your efforts are actually moving the needle.
The Formulas You Need for Calculating SOV
Alright, let's get down to the brass tacks. Moving from the idea of Share of Voice to actually measuring it is where the real work begins. The core concept is pretty straightforward, but the specific metrics you'll use will definitely shift depending on the channel you're looking at.
The good news? You don't need a PhD in statistics to figure this out.
The fundamental formula is refreshingly simple and works everywhere:
(Your Brand's Metric / Total Market Metric) x 100 = Your Share of Voice %
Think of this as your north star. Your job is to plug in the right numbers for "your brand" and the "total market" for each channel that matters to your business. If you want to get even deeper into the math, this guide on Share of Voice Calculation is a fantastic resource that breaks it all down.
Let's see how this formula comes to life in the wild.
Paid Search Impression Share
When it comes to paid search on platforms like Google Ads, measuring SOV is about as direct as it gets. The key metric here is Impression Share, and luckily, it's usually handed to you on a silver platter right inside your ad platform's reporting suite.
Impression Share tells you what percentage of potential impressions your ads actually received. So, if your Impression Share is 60%, it means your ads are showing up for 60% of the searches they were eligible for. The other 40%? That's the territory your competitors are grabbing. Simple as that.
Organic Search Visibility
Figuring out SOV for organic search requires a bit more legwork. Why? Because you have to define the "total market" yourself. This typically means building and tracking a specific list of high-intent, high-value keywords for your industry.
Once you have that list, the formula looks something like this:
- Your Metric: Your website's total clicks or impressions from that keyword basket.
- Total Market Metric: The combined total of clicks or impressions for every competitor ranking for those same keywords.
Let's say your site pulls in 1,500 clicks from a group of 50 target keywords. After doing some competitive analysis, you find the total clicks available across all ranking sites for that keyword set is 10,000. Your organic search SOV is 15%. You'll almost certainly need a good SEO platform to pull this kind of competitive data without losing your mind.
This is where you can start turning raw data into a real feedback loop.
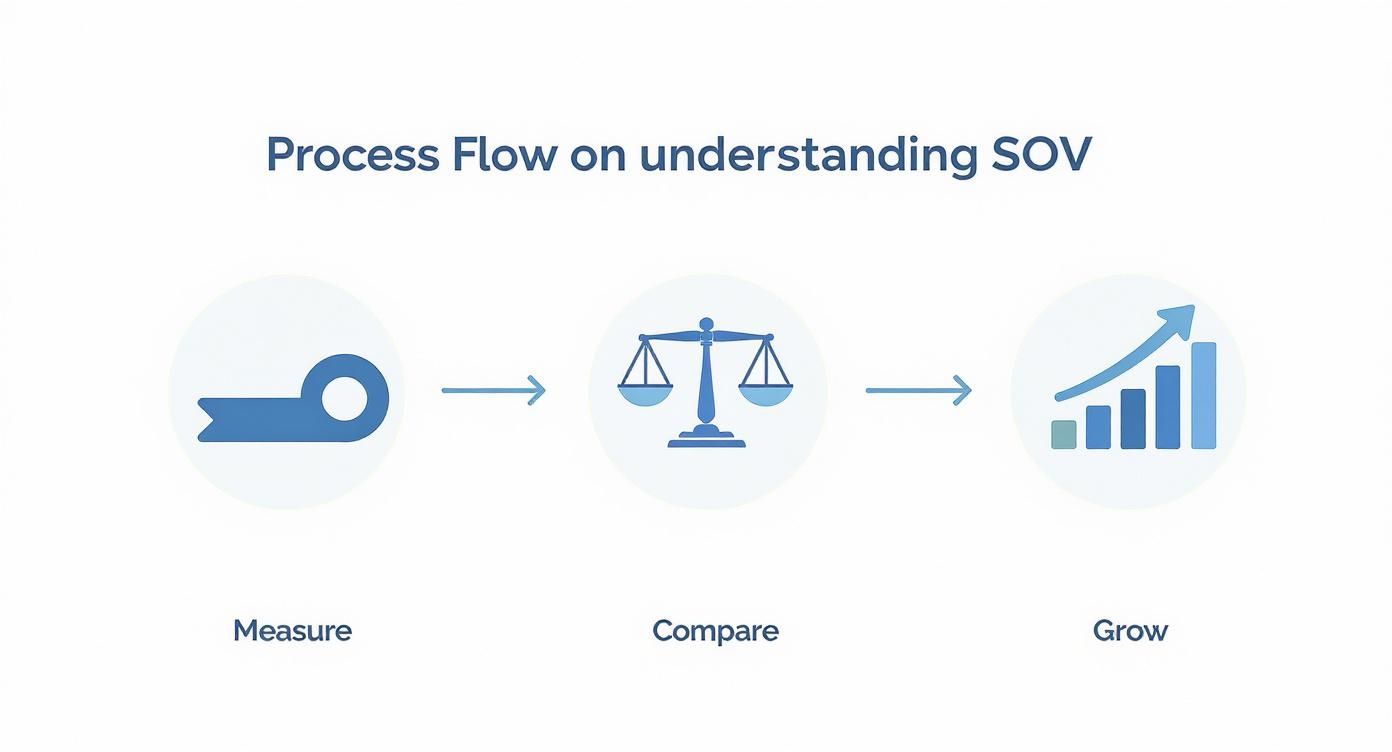
Remember, measurement is just step one. The real magic happens when you use these insights to figure out where you stand and what moves you need to make next.
Social Media and Media Mentions
For social media and press coverage, SOV is all about who owns the conversation. You're tracking how often people are talking about your brand versus how often they're talking about your competitors.
Here’s a quick real-world example. A new coffee startup wants to measure its SOV on Instagram around the hashtag #ArtisanRoast. They dig in and find their brand was tagged 200 times last month. They also know their two biggest competitors were mentioned 500 and 300 times, respectively.
The math is easy:
- Your Mentions: 200
- Total Market Mentions: 200 (You) + 500 (Competitor A) + 300 (Competitor B) = 1,000
- Your SOV: (200 / 1,000) x 100 = 20%
You can apply this same logic to anything—brand mentions, campaign hashtags, or key industry terms—to get a clear picture of how much of the conversation you actually own.
How to Gather Accurate Data for SOV
Let's be blunt: your Share of Voice calculation is only as good as the data you put into it. The old "garbage in, garbage out" saying has never been more true. To get a number you can actually trust, you need a solid, consistent process for sourcing information across every channel you care about.
For your own turf—paid and organic search—the data is usually right at your fingertips. For paid search, you can pull your Impression Share report directly from your Google Ads account. When it comes to organic visibility, Google Search Console is the source of truth for impression and click data tied to your most important keywords. These are first-party sources, so you can count on their accuracy.
Sourcing Data for Earned and Social Media
Things get a lot trickier when you venture into earned and social media. Manually trying to catch every single brand mention, competitor soundbite, and media feature across the web is a recipe for disaster. You'll miss things, and the data will be incomplete.
This is where dedicated monitoring tools become non-negotiable. They do the heavy lifting for you, listening to the digital chatter 24/7.
- Social Listening: These platforms track brand names, hashtags, and even sentiment on sites like X (formerly Twitter), Reddit, and Instagram.
- Media Monitoring: They constantly scan news sites, blogs, and online publications for mentions of your company and your rivals.
- Competitor Tracking: The best platforms will even alert you the moment a competitor launches a new ad campaign or lands a big piece of press.
For instance, a competitor monitoring platform like ChampSignal gives you a command center for all this intelligence, pulling everything into one clear view.

This kind of dashboard lets you see what everyone else is doing without spending hours digging through search results and social feeds.
Here’s how this plays out in the real world: I worked with a B2B SaaS client who used a monitoring tool to track industry keywords. They stumbled upon a highly active conversation on a niche developer forum their main competitor had completely ignored. They jumped in, offered genuine advice, and built a small but fiercely loyal community. This led directly to new sign-ups—an opportunity that manual tracking would have absolutely missed.
If you want to get more tactical on this front, our guide to effective content monitoring breaks down more of these strategies.
The most important thing is to be consistent. Decide who your core competitors are and which keywords matter most, then stick to them. Pull your data at the same time every month or quarter. This discipline is what turns a messy pile of data into a strategic advantage.
Turning Your SOV Numbers into Strategy
So you've run the numbers and you have a percentage in hand. What now? The real magic isn't in the calculation itself; it's in turning that raw data into a smart, actionable roadmap. A standalone number, after all, doesn't tell you much without context.
For example, a 10% share of voice might make you the king of the hill in a super fragmented niche market. But in an industry dominated by two behemoths, that same 10% could mean you’re barely a blip on the radar. The key is to frame your analysis within the reality of your industry and your own business goals.
What “Good” SOV Actually Looks Like in Different Markets
The definition of a "good" share of voice can change dramatically from one industry to the next. A CPG brand might be perfectly happy holding a steady 15% of the conversation year-round just to stay top-of-mind. A tech brand's SOV, on the other hand, is often far more volatile and tied to specific events.
Think about the tech world. During a new iPhone launch, Apple might temporarily command a massive 45% of the social media conversation. At the same time, Samsung might hold around 25%. It's not unusual for leading tech brands to spike to 30-50% SOV during these key moments, which is worlds away from what you'd see in other markets.
This just goes to show that your goals have to be grounded in reality. Trying to capture 50% SOV in a stable, mature industry is probably a massive waste of resources. But grabbing that same level of attention during a critical product launch? That could define your entire year.
The goal isn’t just to report on your Share of Voice; it’s to understand the story the numbers are telling. A sudden drop might signal a new competitor entering the market, while a steady increase could validate a recent content strategy.
From Analysis to Actionable Insights
Once you get the context right, you can start using SOV trends to make smarter, more proactive decisions. Tracking this stuff consistently lets you see competitor moves coming, spot channels they’re ignoring, and build a rock-solid case for your marketing budget.
Here’s how you can translate your SOV analysis into actual moves:
- Anticipate Competitor Plays: Did a rival’s paid search SOV just spike out of nowhere? They're almost certainly ramping up for a big campaign or product launch. This gives you a heads-up to prepare a counter-move instead of being caught flat-footed.
- Spot Channel Opportunities: Maybe you discover you have a 25% SOV on LinkedIn but only 5% on Reddit—a platform your competitors are completely ignoring. That "channel gap" is a golden opportunity to own the conversation where nobody else is even trying.
- Justify Your Marketing Spend: SOV data is powerful stuff when you're talking to leadership. Instead of just presenting standard campaign metrics, you can paint a much clearer picture: "We invested $X in this channel, which grew our share of voice by Y%, pushing us ahead of Competitor Z." This ties your team's work directly to market positioning.
Getting this analysis right is a cornerstone of strong marketing. If you’re looking to sharpen your reporting skills, our guide on building powerful marketing reports offers a great framework. From there, you can explore proven strategies to improve website visibility and directly boost your brand’s share of the conversation.
Connecting Share of Voice to Market Growth
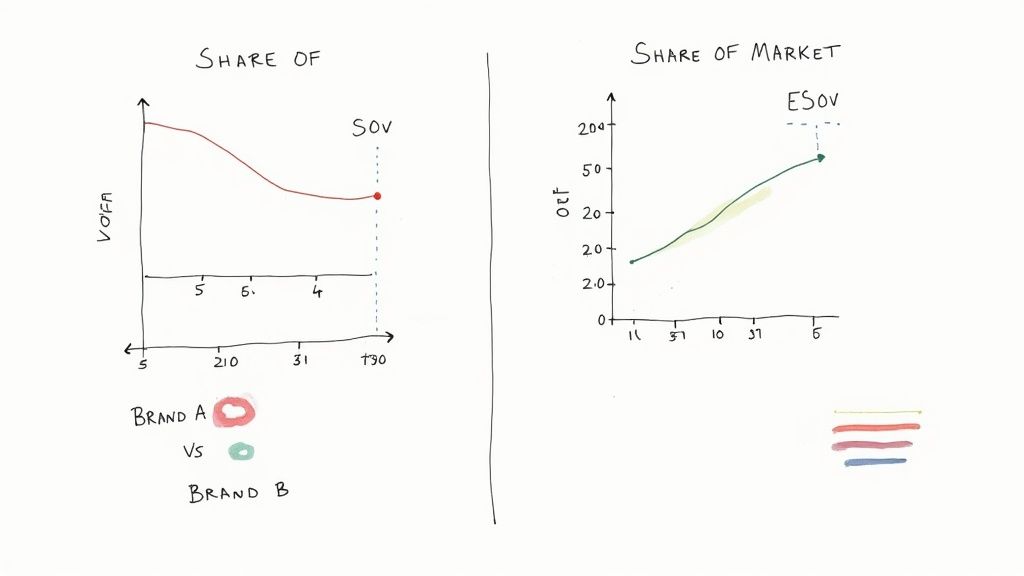
This is where the rubber meets the road. Calculating your share of voice is one thing, but connecting that metric to actual business growth is what really matters. This is how you turn a simple marketing number into a powerful argument for more investment. The concept that bridges this gap is called Extra Share of Voice (ESOV).
The idea behind ESOV is pretty straightforward but incredibly powerful. For your brand to grow, your Share of Voice (SOV) needs to be higher than your current Share of Market (SOM). It’s like putting a down payment on future growth—the "extra" visibility you generate today directly translates into the market share you'll own tomorrow.
The ESOV Growth Principle
Let's put this into a real-world context. Say your company currently has a 10% slice of the market. If you can manage to maintain a 15% SOV, you're essentially "punching above your weight." You're being seen and heard more often than your current market position suggests, which is exactly the kind of momentum that fuels growth.
On the flip side, imagine a market leader with a 20% market share that only pulls off a 10% SOV. That's a red flag. This gap signals they're underinvesting in their brand's presence, leaving the door wide open for you or another aggressive competitor to swoop in. It's almost a guarantee that their leadership position will start to weaken over time.
The link between Share of Voice (SOV) and Market Share (SOM) isn't just a theory; it's backed by years of research. Studies have consistently found that brands with an 'extra' share of voice—where their advertising and media presence is greater than their market share—are significantly more likely to grow. You can dig into the data from Nielsen to see the numbers for yourself.
This entire framework gives you a concrete model for setting growth targets that are both ambitious and achievable. It elevates SOV from a historical metric you report on to a strategic lever you can pull to shape the future.
Once you understand this dynamic, you can set precise SOV goals tied directly to your market share ambitions. This makes conversations about budgets with your leadership team far more productive. Solid competitive benchmarking is the bedrock here, allowing you to accurately track both your SOV and SOM against rivals. With this data in hand, you have the evidence needed to justify marketing spend and prove its long-term value to the business.
Common Questions About Share of Voice
Even after you've mastered the formulas and lined up your data sources, some very real-world questions tend to bubble up once you start digging into Share of Voice. Getting these right is the key to turning raw data into a real strategic advantage. Let's walk through a few of the most common ones I hear from marketers.
How Often Should I Calculate Share of Voice?
Honestly, there's no one-size-fits-all answer here. The right frequency really depends on the pulse of your specific market.
A good rule of thumb is to match your measurement cadence to the industry's pace.
- Fast-Paced Industries: Think e-commerce, consumer tech, or fast fashion. Trends can ignite and burn out in a week. Here, checking in bi-weekly or even weekly is smart. It allows you to pivot fast, responding to competitor blitzes or sudden shifts in what customers are talking about.
- Stable B2B Markets: For many B2B niches, things move more deliberately. A monthly or quarterly analysis is usually plenty to spot meaningful trends without getting bogged down by minor daily noise.
Of course, all bets are off during big events. If you're in the middle of a major product launch or a huge marketing push, you’ll want to be on top of your key SOV metrics almost daily. This is your chance to make real-time tweaks to your strategy and budget, ensuring you're getting heard when it counts the most.
What Is a Good Share of Voice to Aim For?
This is the big one, isn't it? The truth is, "good" is completely relative. There’s no magic number to hit. Instead, a good SOV is a strategic one.
For any challenger brand, a powerful goal is to achieve a Share of Voice that's higher than your current Share of Market (SOM). This concept, known as Extra Share of Voice (ESOV), is one of the most reliable predictors of future market share growth. It's about punching above your weight.
If you’re already the market leader, your goal is more defensive—you need to maintain a dominant SOV to protect your turf. If you're a smaller player, focus on owning the conversation in a specific niche or on one channel. It’s far better to dominate a single, relevant conversation than to be a faint whisper across all of them.
The most practical approach is to benchmark directly against your competitors. If your closest rival holds a 20% SOV on social media, aiming for 25% gives you a concrete, strategic goal that can guide your every move.
Can I Calculate SOV With Free Tools?
You absolutely can. While premium platforms offer incredible automation and depth, you can get a surprisingly solid estimate of your Share of Voice without spending a dime. It just takes a bit more elbow grease.
With a little creativity, you can piece together a clear picture.
- Google Alerts: This is a fantastic, no-cost way to track mentions of your brand—and your competitors'—across the web.
- Manual Social Searches: It's old-school, but simply searching for brand names, campaign hashtags, and key phrases on platforms like X (formerly Twitter) and LinkedIn can give you a rough but useful count.
- SEO Tool Trials: Many of the best SEO tools offer free trials or have limited free versions that let you track keyword rankings for a core set of terms.
These methods are perfect for establishing a baseline and getting a feel for your visibility, all without needing any budget approval.
Stop guessing what your competitors are doing. ChampSignal delivers high-signal alerts on competitor ad strategies, pricing changes, and SEO moves directly to your inbox. Start your free trial and turn their strategy into your advantage.
Stay Ahead
Don't just find competitors. Stay ahead of them.
Auto-discover new competitors in your market. Get alerts when they change pricing, features, emails, ads, or messaging.
Stay ahead without the tracking busywork.
See competitor pages, emails, social posts, ads, and SEO signals in one place.
What ChampSignal watches for you
The channels competitors own, the places people talk about them, and the alerts that matter when something changes.
Website & Email Monitoring
Page updates, pricing changes, messaging shifts, and competitor newsletters.
Social Monitoring
X posts, Reddit threads, and other public social chatter.
Ads Monitoring
Ad copy, creatives, and landing pages across Google and Meta.
SEO Monitoring
Keywords, backlinks, and ranking shifts tied to competitor pages.
Auto Competitor Discovery
New rivals surfaced before they show up in deals or search.
High-Signal Alerts
The few alerts and digests that matter, delivered by email or Slack.