Competitive Intelligence Report
 posthog.com
Contents
Competitor List
Direct, indirect, and alternative competitors of posthog.com
| Competitor | Type | Rationale | Sources |
|---|---|---|---|
| Direct | Amplitude is a direct competitor to PostHog because both offer comprehensive product and digital analytics platforms—with features like behavioral analytics and experimentation—for teams building and optimizing web and mobile products. | ||
| Direct | Both PostHog and Mixpanel are event-based product analytics platforms used by product and engineering teams to understand and improve user behavior in web and mobile products. | ||
| Direct | Both PostHog and Statsig provide integrated platforms for product analytics, experimentation, feature flags, and related tools for product and engineering teams, so they compete directly to power data-driven product development. | ||
| Direct | Heap is a direct competitor to PostHog because both offer product analytics and broader digital insights platforms (including automatic event capture, web analytics, and session replay) used by product and data teams to understand user behavior and optimize digital experiences. | ||
| Direct | Pendo offers a product experience and analytics platform with product analytics, in-app guides, and session replay for product teams to understand and improve software usage, which directly overlaps with PostHog’s Product OS offering of product analytics, web analytics, session replay, feature flags, and related tooling for product engineers. | ||
| Direct | LaunchDarkly is a direct competitor to PostHog because both provide feature flagging, experimentation, and analytics platforms for software development and product teams evaluating tools to safely ship and test features. | ||
| Direct | Fullstory is a behavioral data and digital analytics platform that provides product analytics and session replay to help teams understand and optimize user behavior, overlapping directly with PostHog’s Product OS capabilities for product engineers. | ||
| Direct | Hotjar competes directly with PostHog as a behavior and product analytics platform offering tools like heatmaps, session replay, funnels, and surveys to help teams understand and optimize digital experiences. | ||
| Direct | LogRocket directly competes with PostHog by offering an AI-first platform for session replay, product analytics, UX analytics, and error tracking aimed at helping product and engineering teams understand and optimize user behavior in web and mobile apps. | ||
| Direct | Twilio Segment is a leading customer data platform (CDP) that, like PostHog’s CDP capabilities, helps product and data teams collect, unify, and activate customer event data, and PostHog explicitly positions its CDP as a replacement for Segment, making it a direct competitor. |
Positioning Grid
How competitors of posthog.com position themselves
| Competitor | Tagline | Promise | ICP | Differentiator |
|---|---|---|---|---|
 You You | "We make dev tools for product engineers " | An all-in-one Product OS that helps engineers analyze, test, observe, and ship successful products. | Product engineers and engineering teams (startup to scale) who want product context without a complex data stack. | One platform combining analytics, replay, flags, experiments, CDP and warehouse—open-source, generous free tiers, no sales-led motion. |
"The AI analytics platform for testing everything. " | Amplitude gives you the self-serve tools and real-time data to make products and experiences that win no matter what. | Product, marketing, data, and engineering teams building and optimizing digital products and customer journeys. | Ask-anything AI analytics plus AI Agents that sense, analyze, and optimize 24/7—within a consolidated platform. | |
"Analytics that drive decisions" | Turn user behavior insights into clear next steps, without delays or SQL bottlenecks. | Product, engineering, marketing, and data teams improving product and web experiences. | AI-powered data clarity with Metric Trees, governance, and fast self-serve analytics across warehouse/SDK/CDP data. | |
"Measure what ships. Ship what matters." | Test every release with flags, experiments, and metrics, then analyze impact with advanced statistics and product analytics. | Product, engineering, and data teams shipping digital products (including AI experiences), from startups to enterprises. | 5+ integrated tools (analytics, flags, experiments, replays) plus warehouse-native deployment and a world-class stats engine. | |
"Better Insights. Faster. " | Complete understanding of customers’ digital journeys to improve conversion, retention, and customer delight. | Product teams at SaaS, ecommerce, and financial services companies optimizing acquisition, retention, and expansion. | Autocapture: one snippet captures every interaction—no engineering—plus data science and session replay to expose friction. | |
"Understand and guide users. Then prove impact. " | Analytics and adoption platform to understand behavior, guide users in-app, and prove impact on business outcomes. | Customer success, product, and builder teams at companies with portfolios of apps and agents. | Positions itself as portfolio-wide infrastructure, powered by 35 trillion collected events and AI for products and agents. | |
"One platform for developers to ship with confidence." | De-risk every release and reduce outages with feature flags, observability, experimentation, analytics, and AI configuration. | Software developers and DevOps/engineering teams at mid-market and enterprise building customer-facing digital products and AI applications. | Unified feature management + experimentation with real-time global flag delivery (sub-200ms updates) and enterprise governance for production safety. | |
"Better data. Better digital experiences. " | Build better digital products with insights from always-on AI-agent analysts. | Product, engineering, UX, analytics, marketing, and support teams improving website and app experiences. | Privacy-first Fullcapture records every interaction; StoryAI/Ask StoryAI turns it into instant, context-rich answers. | |
"Hotjar has evolved into something more powerful " | A powerful, easy-to-use platform to go from insight to impact, fast—so you can understand and improve your website/app. | UX designers, CRO specialists, and marketers optimizing website/app user experience and conversion. | Brings behavior insights, customer feedback, and product analytics together in one connected platform (as part of Contentsquare). | |
"Everything you need to understand and optimize user experiences, built for the AI-first age" | Unify session replay, product analytics, error tracking, and performance monitoring to quickly diagnose issues and improve UX. | Engineering, product, UX, and support teams responsible for web and mobile app user experiences. | Galileo AI proactively identifies impactful technical/UX issues and summarizes sessions so teams can act faster. | |
"Turn every customer interaction into a unique customer experience. " | Brings together clean, consented customer data for real-time insights to personalize customer experiences. | Data engineers, marketers, and product managers who need unified, identity-resolved customer profiles across tools. | One API plus 700+ pre-built connectors to send data to hundreds of tools without building each integration. | |
ICP Signals & Use Cases
Who competitors of posthog.com target and what problems they solve

Target Audience
- Product engineers / engineers building product (dev-tool positioning: “We make dev tools that help product engineers build successful products.”)
- Data teams (plus product teams) needing an integrated “data stack”/single source of truth (“PostHog data stack, built for data teams and loved by product teams…”)
- Companies by stage: Startup/Side project → Growth → Scale (implies self-serve adoption across maturity levels)
- Developers and startups who want deep, end-to-end product journey insight (marketing site explicitly calls out “Developers and startups… track the complete journey…”)
- Privacy/compliance-sensitive orgs (EU data residency + GDPR posture; option to self-host or use EU Cloud so data never leaves EU)
Use Cases
- Product analytics to understand user behavior and feature usage (autocapture + funnels/retention/cohorts) and answer product questions like churn/retention/power users.
- Session replay to diagnose UI issues/friction and improve customer support by replaying real user sessions with context.
- Feature flags to safely roll out/kill-switch features and target cohorts/individuals before full release (test impact prior to rollout).
- Experimentation (A/B, A/B/N, etc.) to validate product changes with statistical significance, including precise targeting/exclusion and analysis alongside session replay.
- Unify analytics with broader customer/business data via built-in warehouse + importing data from external tools (e.g., Stripe/HubSpot/Zendesk) to make better build/priority decisions from a single source of truth.

Target Audience
- Product teams building and optimizing digital products (product analytics + experimentation)
- Marketing teams who need self-serve, full-funnel behavioral insights tied to acquisition/engagement/revenue
- Data/analytics teams responsible for trusted, governed data and enabling self-serve analytics across the org
- Engineering teams shipping features safely (feature flags, release dashboards, experimentation)
- Company-size spectrum: startups/small teams → large enterprises (incl. Fortune 100)
Use Cases
- Understand the full user journey and identify drivers of retention/churn, engagement, and conversion (behavioral analytics + journey/funnel views + qualitative context)
- Optimize acquisition + marketing performance: reduce CAC, improve onboarding conversion, and connect channel/campaign performance to downstream outcomes (revenue, retention)
- Ship and roll out features with confidence using feature flags and experimentation, and measure impact automatically after releases
- Enable org-wide self-serve insights while maintaining data quality, security, and governance (reduce ad-hoc data requests and analyst bottlenecks)
- Increase monetization by finding revenue-driving journeys and fixing funnel friction, then activating targeted cohorts/offers

Target Audience
- Cross-functional digital product teams (Product, Data/Analytics, Marketing/Growth, Engineering) who need shared self-serve product analytics
- Organizations optimizing mobile + web products (apps, websites) with event-based behavioral data
- Companies scaling from self-serve to enterprise (Growth + Enterprise tiers), including high-volume event tracking needs
- Early-stage startups (founded <5 years, up to $8M funding) seeking discounted/free analytics to reach product-market fit
- Regulated/security-conscious enterprises needing governance & compliance (SOC 2 Type II, ISO 27001, HIPAA-ready, SSO/SAML, audit logs)
Use Cases
- Improve acquisition/onboarding by finding funnel drop-offs and optimizing user journeys
- Increase engagement and retention by identifying sticky behaviors/features and tracking cohorts over time to reduce churn
- Prove and optimize marketing ROI (optimize ad spend, identify most influential touchpoints, campaign performance reporting)
- Support engineering/debugging by using event tracking to identify issues like crashes/errors and performance/bottlenecks in user flows
- Track cross-platform user journeys (web + mobile site + app) and build behavioral cohorts for targeted re-engagement campaigns

Target Audience
- Cross-functional product orgs (Engineering, Product Management, Data Science, DevOps) collaborating on releases + measurement
- Industries with high-volume product iteration needs: Gaming, B2B SaaS, E-Commerce
- Companies across maturity stages: individual builders → growing teams → large enterprises (self-serve + enterprise contracts)
- Data-warehouse-centric organizations that want “warehouse native” deployment / data governance
- Marketing teams (and non-engineers) running web/marketing experiments without engineering support
Use Cases
- Run advanced product experimentation (A/B/n, mutually exclusive experiments, sequential/switchback tests, bandits) with a dedicated stats engine
- Feature flagging / release management: gradual rollouts, targeting, approvals/controls, and impact monitoring tied to product metrics
- Unify product analytics with experimentation + flags (trusted metrics, exploration/segmentation) to understand user behavior and feature impact
- Diagnose UX pain points via Session Replay (connected to flags/experiments/metrics)
- Low-code website/marketing experiments via Visual Editor/Sidecar (edit text/styles, redirects/scripts, targeting by URL/geo/device, auto-captured metrics; marketing-to-product funnel experiments)

Target Audience
- SaaS product organizations ("SaaS teams of all sizes") needing behavioral/product analytics without heavy instrumentation.
- eCommerce marketing teams on Shopify focused on conversion/AOV/repeat purchases (Heap + Shopify).
- Financial services (FinServ) companies optimizing digital journeys across web + mobile to grow conversion/share-of-wallet.
- Cross-functional digital/product stakeholders: Product, Design, Engineering, and Leadership collaborating on roadmap priorities.
- Broad market from low to high analytics maturity / non-technical teams (self-serve analytics).
Use Cases
- Autocapture behavioral events (clicks/pageviews/forms, etc.) with minimal engineering; retroactive/"lookback" analysis so you don’t need a tracking plan up front.
- Funnel/conversion optimization: find friction in user flows, compare paths leading to conversion, and segment cohorts to identify drivers of conversion.
- Product adoption/activation: identify early behaviors that predict long-term value/retention and design onboarding/UX to drive users to “aha” moments.
- Product-led growth (PLG): help Growth teams understand usage, demonstrate value during onboarding/activation/conversion, and iterate quickly based on engagement data.
- Session replay for qualitative context: diagnose why users struggle, troubleshoot issues pre-support, and align teams on the highest-impact roadmap investments.

Target Audience
- B2B SaaS product teams (product managers / product operations) trying to increase adoption, reduce churn, and tie product work to business outcomes
- B2B SaaS marketing teams (demand gen, lifecycle, PLG) who want to connect pre-conversion + in-product behavior and run in-app experiences without engineering
- IT / Digital workplace leaders (CIO org) improving employee software experiences—driving internal adoption, reducing support load, and addressing compliance/security risks
- Organizations rolling out employee-facing digital adoption programs across a portfolio of SaaS + internal apps (process analytics, portfolio insights, in-app support)
- Teams building and deploying AI agents/tools that need to measure adoption and business impact (ROI)
Use Cases
- Product analytics to understand what users actually do (feature usage, journeys, retention) and turn insights into business outcomes—without manual event tagging
- Drive onboarding + feature adoption using no-code in-app guides/messaging (reduce reliance on engineering, improve time-to-value)
- Predict and prevent churn (and identify upsell/expansion opportunities) using behavioral signals
- Measure AI agent/tool adoption and connect it to outcomes like retention, conversion, and revenue (prove AI ROI)
- Digital adoption for employee software: scale training/onboarding, reduce support tickets, optimize software spend, and improve compliance/governance across the tech stack

Target Audience
- Software developers building and shipping software who need feature flags + experimentation to de-risk releases.
- DevOps + Site Reliability Engineering (SRE) teams focused on SLOs, reliability, incident reduction/response, and real-time control.
- Product managers who want to control releases, run experiments, target audiences, and manage entitlements with less developer involvement.
- Mobile app development teams that need to release features/fixes independent of app store timelines and manage complex device/version targeting.
- Mid-market to enterprise orgs (and regulated industries) needing enterprise-grade governance/compliance and scale; also signals via enterprise plan tiers and compliance standards.
Use Cases
- Progressive delivery: decouple deployment from release so teams can deploy anytime and release safely via toggles.
- Testing in production + controlled rollouts (canary, percentage, ring deployments) to limit blast radius and validate performance/engagement before full launch.
- Incident mitigation and faster recovery: kill switches/instant rollbacks and automated remediation when observability metrics degrade.
- Experimentation & A/B testing integrated into feature delivery (front-end + server-side), so teams can ship winners faster.
- Entitlements and tier-based feature access (trials, betas, premium tiers) controlled via flags with access controls—reducing engineering tickets.

Target Audience
- Product & engineering teams responsible for shipping and improving digital product experiences
- Data & analytics / data science teams (incl. orgs building predictive models and GenAI/LLM use cases)
- Customer support teams that need full context to troubleshoot customer issues faster
- IT & internal support teams optimizing internal tools and employee workflows (digital employee experience)
- Industry-specific digital businesses, especially Retail & Ecommerce, Travel & Hospitality, Financial Services, Gaming & Gambling, SaaS, and Food & Beverage
Use Cases
- Uncover and remove friction in customer journeys to improve UX and conversion outcomes (web + mobile, cross-device)
- Pinpoint and resolve digital experience issues faster by seeing what users saw (root cause, faster time-to-resolution, prevent recurring incidents)
- Equip customer support with session context (replays/AI summaries) to cut investigation time and help users faster
- Improve employee experience/productivity by optimizing internal tools and reducing workflow friction
- Activate behavioral data to deliver real-time personalization (content/offers/experiences) across the tech stack

Target Audience
- Product managers responsible for improving user journeys and conversion-critical flows in a digital product
- Product designers / UX designers optimizing page UX and interaction design using behavioral evidence
- UX / user researchers running qualitative research (e.g., usability tests/interviews) alongside behavioral analytics
- Websites and apps teams (broad market) who need privacy-ready behavior analytics at scale
- Enterprise digital experience teams who need large-scale optimization + monitoring capabilities (beyond basic session replay/heatmaps)
Use Cases
- Identify what’s working vs. not on any page via heatmaps (click/move/scroll) to target UX improvements
- Debug confusing experiences and drop-offs by watching session replay / recordings (and summarizing key moments)
- Pinpoint funnel drop-off points and blockers (including segment/device comparisons) to prioritize fixes
- Collect Voice-of-Customer feedback fast using on-site surveys + analyze responses (templates, AI summaries/sentiment) and recruit follow-ups
- Prioritize optimizations by quantified impact (including revenue goals/tracking) rather than just qualitative evidence

Target Audience
- Frontend engineering / developer teams building JavaScript web apps (incl. React/Redux/Angular) who need deeper debugging context than traditional error trackers
- Product & UX teams focused on optimizing conversion and adoption through behavioral analytics + qualitative replay
- Support / customer experience teams responsible for resolving user-reported issues and reducing back-and-forth with engineering
- Mid-market to enterprise orgs operating at very high session volumes (≥1M sessions/month), needing security/compliance and optional self-hosting
- Startups / smaller teams (explicitly <20 employees) looking for a scalable plan as they grow
Use Cases
- Debug and reproduce user-reported issues by pairing pixel-perfect session replay with console logs, JS errors, stack traces, and network request/response details
- Automatically detect and prioritize high-impact UX/technical problems ("user struggle") using AI (Galileo) rather than manually triaging noise
- Increase activation/conversion by finding friction in onboarding and key flows using session replay + funnels/path analysis
- Monitor and troubleshoot frontend performance by correlating performance telemetry with UX impact (especially for modern SPAs)
- Operate session replay/analytics at scale while controlling cost and focusing capture on what matters (conditional recording), including large rollouts

Target Audience
- Data engineers / data engineering teams who need high-throughput, reliable customer event collection and routing
- Marketing teams (growth, lifecycle, performance marketing) focused on first‑party data activation for personalized campaigns and ads performance
- Product teams / product managers needing a complete customer view for product analytics, experimentation, and personalization
- Mid-market to enterprise orgs with complex stacks that require governance, roles/permissions, and standardized data pipelines
- Regulated and/or global organizations needing compliance and data residency controls (e.g., HIPAA eligibility, regional infrastructure)
Use Cases
- Collect first‑party customer data from web/mobile/server/cloud apps via a single API and route it to downstream tools and data warehouses (750+ destinations)
- Create an identity-resolved single customer view by unifying events and warehouse data into real-time customer profiles
- Build and activate audiences for marketing and advertising to improve ROI/ROAS (first‑party audience targeting)
- Orchestrate personalized, multichannel customer journeys (real-time journey orchestration)
- Privacy, compliance, and data governance (consent-based collection, PII controls, deletion/suppression, data quality enforcement)
Feature Inventory
Product features extracted from competitors of posthog.com
| Competitor | Feature | Category | Description |
|---|---|---|---|
 Amplitude 30
features | AI Agents (always-on) | Goal‑oriented AI experts embedded in Amplitude that continuously analyze your analytics, session replay, experimentation, and guides/surveys data to surface insights and recommend actions. | |
| Human-in-the-loop actions | Agents can carry out actions you approve (e.g., running an experiment or sending targeted guidance), and won’t make customer-facing changes without your approval. | ||
| Scheduled reports & alerts | Create and schedule multiple agents and push takeaways/updates to email, Slack, and other destinations via recurring notifications. | ||
| MCP for AI tools | Amplitude MCP (Model Context Protocol) server brings governed behavioral context into tools like Claude and Cursor so teams can ask questions in plain language and get answers based on live Amplitude data. | ||
| AI Feedback ingestion hub | Aggregates customer feedback from sources like support tickets, surveys, app reviews, social media, and call scripts into a unified dashboard. | ||
| Feedback-to-action workflows | Links “what users say” to “what they do” by connecting insights to cohorts, Session Replay, experiments, and even creating guides/surveys from insights; includes natural-language analysis and drafting (e.g., PRDs). | ||
| AI Visibility score | Measures how AI assistants talk about your brand (visibility score, mentions, rank, citations) and compares competitors/share-of-voice with weekly updates. | ||
| AI Visibility to revenue | Connects AI visibility performance to outcomes like AI-sourced traffic, conversion paths, and revenue metrics (closing the loop from AI mention to purchase). | ||
| One-line analytics setup | Automates baseline product reporting (dashboards/charts) with “just one line of code,” surfacing real-time user metrics with minimal customization. | ||
| Out-of-the-box reporting views | Out-of-the-box Product Analytics supports “Views” so different teams can customize settings like active events, retention intervals, onboarding funnels, and tracked features. | ||
| Best-practice templates | Provides expert-built templates and charts to speed time-to-insight and flatten the learning curve for teams. | ||
| Natural-language analysis | Ask questions about your product without needing to know your taxonomy; use AI to generate and customize charts with natural language. | ||
| Behavioral targeting actions | Drive engagement with tailored in-product communication based on behavioral insights (e.g., guiding onboarding/activation and prompting feature discovery). | ||
| Metrics & goal tracking | Set metrics and track goals; save and standardize metrics across charts, cohorts, and tables. | ||
| Multi-dimensional segments | Analyze and compare metrics across multi-dimensional user segments to pinpoint growth drivers (including campaign-related behaviors). | ||
 Mixpanel 30
features | Insights reports | Analyze events, cohorts, and user profiles to visualize trends and compositions; advanced capabilities include formulas, comparing current vs past, and creating custom events/properties for deeper analysis. | |
| Funnels report | Measure conversion through a sequence of events with configurable conversion criteria (e.g., conversion window) and advanced options like “Optimized Re-entry” for capturing subsequent funnel entries. | ||
| Flows report | Identify the most frequent paths users take to or from any event (e.g., via Sankey-style user flows), with options like expanding steps and breaking down journeys by segments. | ||
| Retention report | Measure engagement over time by defining a “Retention Behavior” (do an event, then come back to do another), with multiple measurement types (e.g., retention rate, uniques, property sum). | ||
| Cohorts builder | Visually define cohorts based on user properties and/or behavioral conditions, then use cohorts for filtering/breakdowns, sharing, and downstream targeting workflows. | ||
| Cohort Sync | Export cohorts to external destinations (e.g., Braze, Facebook Ads, Google Ads) with one-time, scheduled, or real-time sync cadences to operationalize analytics audiences. | ||
| Boards | Collect reports (Insights, Funnels, Flows, Retention) plus text/media into a single view for tracking KPIs at a glance, with sharing and organization features like favorites and pinned boards. | ||
| Board subscriptions | Subscribe to a Board to receive scheduled updates on key metrics via email or Slack, including sending updates to people outside your immediate team. | ||
| Spark (AI report builder) | Use natural language prompts from Boards to generate Insights, Funnels, Retention, and Flows reports; iterate on prompts and save results back to the Board. | ||
| Session Replay | Watch playbacks of user experiences to investigate drop-offs discovered in analytics, with entry points from Mixpanel reports and user profiles. | ||
| Replay privacy masking | Session Replay data is masked by default, with controls for what to unmask so teams can collect only what they need. | ||
| Replay playlists & filters | Filter large volumes of replays into a focused set using Mixpanel events, properties, and cohorts to quickly narrow to the sessions that matter. | ||
| Heatmaps | Generate heatmaps powered by Session Replay data, including click maps (element-level) and traditional coordinate heatmaps for understanding engagement and friction. | ||
| Computed sessions | Automatically compute “Session Start” and “Session End” from events with configurable session definitions (timeout-, event-, or property-based) that can be changed historically. | ||
| Warehouse Connectors | Sync data from warehouses (e.g., Snowflake, BigQuery, Databricks, Redshift, Postgres) into Mixpanel via a codeless setup to analyze business/back-end data alongside product usage. | ||
 Statsig 30
features | Unified product platform | A single platform that combines Experimentation, Feature Flags/Feature Management, Product Analytics, Session Replay, Web Analytics, Infra Analytics, and AI Evals so teams can “ship, measure, and learn” in one place. | |
| Warehouse Native (WHN) | Run Statsig’s experimentation and analytics workflows directly on top of your data warehouse (no ETL), while using Statsig’s stats engine for analysis. | ||
| Bring-your-own assignment | Warehouse Native supports bringing your existing assignment/flagging system (or using Statsig’s), while still running analysis in your warehouse. | ||
| Feature Gates (flags) | “Feature Gates” (feature flags) toggle product behavior in real time without deploying new code, with targeting based on user and environment attributes. | ||
| Advanced targeting controls | Sophisticated targeting, environment controls, and customizable release workflows for feature rollouts. | ||
| Scheduled rollouts | Time-based, multi-phase rollout schedules at the rule level that execute automatically. | ||
| Automated rollback alerts | Configure alerts and automate rollbacks when releases show negative impact. | ||
| Real-time release diagnostics | Monitor exposure events and health checks in real time to assess performance and debug quickly during rollouts. | ||
| Overrides & bypass lists | Override gates for specific users (bypass lists) to support testing, dogfooding, and controlled access. | ||
| Chained flag dependencies | Chain Feature Gates in dependent relationships so a top-level “kill switch” can control multiple sub-flags. | ||
| Pulse (built-in A/B tests) | Run lightweight A/B tests for feature launches by treating gated users as control vs. exposed users as treatment. | ||
| Dynamic Configs | Replace hard-coded values with server-defined JSON that can be updated near real time and targeted to different user segments. | ||
| Parameter Stores | Organize remote-configurable “parameters” (instead of gates/experiments/configs), and remap them to any Statsig entity without hardcoding entity names in code. | ||
| Release Pipelines | Infrastructure-aware, multi-stage rollout strategies across environments/regions with time intervals and/or manual approvals, plus instant rollback control. | ||
| Advanced experimentation types | Support for advanced experimentation techniques including sequential and switchback tests, multi-armed bandits, and contextual bandits. | ||
 Heap 30
features | Complete Autocapture | A single snippet automatically captures the entire digital experience (e.g., clicks, pageviews, formfills) across platforms—no tracking plan required. | |
| Lookback retroactivity | Define what to measure later and still analyze historical behavior (“lookback analysis”) because Heap records from the moment you install it. | ||
| Event Visualizer | Point-and-click UI to find, name, and manage events (virtual events) without touching your codebase, with definitions that apply retroactively across the dataset. | ||
| Live Data Feed | A live data feed to inspect incoming data and validate/QA tracking and definitions as you interact with your site/app. | ||
| Governance lifecycle | Governance workflow that moves events through a lifecycle—Define, Validate, Monitor, and Evolve—to keep a clean, trusted behavioral dataset at scale. | ||
| Data Dictionary hub | Data Dictionary plus naming conventions, categories, and version history to keep definitions consistent and understandable across the organization. | ||
| Event repair monitoring | Automated governance monitoring and workflows, including admin notifications and surfacing definitions that haven’t collected data in 72 hours for repair/archival. | ||
| Integrated Session Replay | Native Session Replay is fully integrated with Heap analytics, letting teams move between quantitative analysis and replay context in one platform. | ||
| Replay search & matching | Session Replay includes “intelligent matching & search,” automatically cueing replays to the exact event and letting you search client/server-side events, paths, errors, and clicked text. | ||
| Replay privacy controls | Highly customizable privacy settings for replays/heatmaps (e.g., mask all text, mask all form fields & sensitive content, and mask additional elements via CSS selectors). | ||
| Heatmaps (3 types) | Heatmaps provide “endless visual insights” with Clickmaps, Scroll Depth, and Attention Maps—no tagging or event creation required. | ||
| Rage Click detection | Automatically detects Rage Clicks to help pinpoint hidden user frustration caused by bugs, slow response times, or UX confusion. | ||
| Heap Illuminate layer | Heap Illuminate is the platform’s data science layer that proactively surfaces key insights about friction and opportunity—including behaviors you weren’t following. | ||
| Illuminate Top Events | Illuminate generates a “Top Events” table to show what most influences conversion between two moments in a funnel. | ||
| Illuminate Group Suggestions | Automatically suggests the most important segments (“Group Suggestions”) to examine when you run graphs/funnels to understand conversion and engagement differences. | ||
 Pendo 29
features | Agent Mode | A conversational, agentic way to use Pendo—product teams can ask it to analyze feedback, build reports, or find users for research to automate time-consuming workflows. | |
| MCP data connector | Connect Pendo data to LLMs via the open Model Context Protocol (MCP), including tools like Claude or Agentforce. | ||
| AI Insights recommendations | AI-powered recommendations to uncover trends across user behavior and reveal growth opportunities ("cut through dashboard clutter"). | ||
| No-tagging analytics | Product analytics that "instantly tracks" what drives engagement and retention with “no manual event tagging needed.” | ||
| Retroactive analytics | “Start yesterday” with retroactive product analytics to learn from past behavior. | ||
| Collaborative dashboards | “Automated, collaborative dashboards” that bring quantitative and qualitative data together to rally teams around shared metrics. | ||
| Journey funnels | Visualize how users move through your product to spot navigational patterns, identify drop-off, and see cross-app user journeys across your portfolio. | ||
| Feature adoption analytics | Identify high/low value features, replicate power-user behavior, track usage trends, and spotlight (or sunset) features to drive engagement. | ||
| Nested segmentation | Build precise user segments using behavioral, demographic, or customer attributes, and use “Nested Segments” to combine/exclude segments (like a “do not call” list). | ||
| In-app Guides | No-code in-app guidance to “deploy quickly” and drive adoption with embedded guides, walkthroughs, and tooltips—plus actionable guide metrics. | ||
| Guide Branching | “Guide Branching” uses conditional logic to create personalized paths that adapt to users’ choices for tailored onboarding and training. | ||
| AI guide creation | “AI guide creation” auto-generates guides and steps from simple prompts—no design or coding required. | ||
| Guides Dark Mode | Guides automatically switch when your app switches to dark mode (“Guides Dark Mode”). | ||
| Cross-app guide consistency | Create “cross-app consistency” with cohesive guide experiences across web and mobile apps. | ||
| Cross-channel journeys | Orchestrate combines in-app guides, email, and data so teams can reach users in and out of the product with connected communications. | ||
 LaunchDarkly 30
features | Boolean & multivariate flags | Create simple on/off flags or more complex multivariate flags to control feature variations at runtime. | |
| Context-based targeting | Use LaunchDarkly’s context-based model to target not just users, but devices, environments, companies, locations, and more with rules as simple or complex as needed. | ||
| Segments + synced segments | Group targets into “segments” and create rules for cohorts; import large segments from other product analytics providers and keep them in sync. | ||
| Progressive rollouts | Gradually release changes over time using percentage-based rollouts or expanding segments to limit blast radius and gather insights. | ||
| Preview & simulate targeting | Preview targeting-rule changes by testing which variation a context would receive and how rollout percentages would shift before you go live. | ||
| Release Assistant pipelines | Design ordered, multi-environment “release pipelines” so features progress from local development to production with consistent standards. | ||
| Release workflow automation | Automate multi-step releases with capabilities like scheduling releases in advance and automatically requiring flag change approvals (and packaging these into repeatable workflows). | ||
| Flag triggers (webhooks) | Initiate remote flag changes using a unique webhook URL, enabling third-party tools (like APM systems) to turn flags on/off or adjust targeting. | ||
| Flag lifecycle management | Track flag usage, set TTLs, and auto-clean stale flags to reduce technical debt and keep your flag inventory healthy. | ||
| Feature dependency control | Declare prerequisite and dependent flags so interdependent features only activate in the right situations and stay consistent across platforms. | ||
| Code References | Locate where flags are used across repositories/branches, search references by alias, and see when a flag was last referenced to avoid blind spots. | ||
| Compare and Copy | Compare flag configuration settings between environments and copy/clone rules to replicate setups without manual errors. | ||
| Live Events | Monitor real-time flag activity to quickly identify and resolve issues as changes happen. | ||
| Flag release dashboard | Use a customizable dashboard to organize and filter flags by tags and other attributes for governance and visibility. | ||
| Audit logs | LaunchDarkly automatically creates an audit log of every software change made in the platform to support compliance and reporting. | ||
 Fullstory 30
features | Fullcapture™ autocapture | Tagless autocapture that records every interaction in real time so teams don’t miss behavioral data points. | |
| Auto-adapts to site/app changes | Fullcapture adjusts to changes in your site or app automatically, reducing the need to retag or update events as experiences evolve. | ||
| One global script + server-side processing | Uses “one global script” with server-side data processing to avoid performance hiccups while capturing behavioral data. | ||
| Private by Default (allowlist) | “Private by Default” minimizes risk by capturing no text unless explicitly allowlisted as safe to capture. | ||
| Masking via wireframe replay | Masks elements into wireframes during Session Replay so you can see interactions without capturing sensitive content on Fullstory’s servers. | ||
| Exclude/Mask/Unmask controls | Element-level privacy controls with Exclude, Mask, and Unmask rules for managing what gets captured and replayed. | ||
| Session Replay | Watch sessions to understand the “why” behind user behavior and diagnose experience issues with full interaction context. | ||
| Tabbed-browsing replay context | Session Replay includes behaviors “behind” metrics, including tabbed browsing context. | ||
| Session summaries (one-click) | One-click, AI-generated session summaries provide quick context around a user’s behavior so teams can move faster to action. | ||
| StoryAI Summaries (multi-session) | StoryAI Summaries condense multiple sessions into a readable narrative to spot patterns, blockers, and intent across replays. | ||
| Review recommendations | StoryAI recommends which sessions are most worth reviewing first to prioritize the moments that matter. | ||
| Frustration tags & highlights | Automatically detects frustration signals (e.g., rage clicks, dead clicks, error loops) and rolls them into AI summaries for context. | ||
| Ask StoryAI in Session Replay | Ask StoryAI analyzes a session’s event list to identify key moments, frustration signals, and user sentiment—without watching the full replay. | ||
| Key Moments timestamps | Provides clickable “Key Moments” timestamps so you can jump directly to the most important parts of a replay. | ||
| Behavioral Insights + sentiment | Interprets the user’s experience with sentiment (Positive/Mixed/Negative) plus counts/lists of success and frustration signals. | ||
 Hotjar 30
features | Observe/Ask/Engage suites | Hotjar is packaged into three products: **Observe** (Recordings, Heatmaps), **Ask** (Surveys), and **Engage** (User Interviews). | |
| Heatmaps | Visualize where users **move, click, and scroll** to identify what’s working—and what’s not—on each page. | ||
| Attention Maps | Heatmaps include **Attention Maps** to better understand what grabs users’ attention. | ||
| Heatmap URL filters | Build heatmaps for a single URL or groups of URLs using match types (including **URL matches regex**), and view aggregated data over a single screenshot when multiple pages match. | ||
| Session Replay | Watch real user journeys to spot bugs, confusion, and drop-offs, and connect replays with heatmaps and survey responses for more context. | ||
| One-click replay summary | Session Replay includes a **one-click summary** that highlights key moments so you can spot issues faster. | ||
| Issue detection | Session Replay is enhanced with **AI summaries**, plus **error detection** and **frustration detection**. | ||
| Privacy-first capture | Includes a **privacy-first script built for site speed**, and privacy controls like automatic suppression/anonymization to help protect personal data. | ||
| Funnels | Visualize conversion steps and drop-offs so you can see where users leave and investigate why. | ||
| Sense Chat | Use **Sense Chat** to ask questions like “Where are my users dropping off?” and get practical recommendations. | ||
| Configurable funnel steps | Create funnels with up to **10 steps** based on sessions that viewed a page, clicked an element, or triggered an event, with date filters and session filters. | ||
| Funnel comparisons | Add up to **5 comparisons** (e.g., devices, new vs returning, traffic channels, A/B variants, User Attributes, Events). | ||
| Funnel views | Switch views including **Funnel steps**, **Conversion over time**, and **Metric only** (with conversion rate and average time to convert). | ||
| Connected recordings | Jump from funnels into the **specific recordings** tied to conversions and drop-offs at each step (including for comparisons). | ||
| Trends custom metrics | Create and compare **custom metrics** in charts, track them over time, and add them to your Dashboard. | ||
 LogRocket 29
features | Galileo AI product assistant | Galileo “watches every session,” reads customer feedback, and tracks product changes to proactively surface what’s impacting users before it impacts your business. | |
| Ask Galileo | Ask product questions on demand and get answers instantly—without extra work or chart building. | ||
| Galileo Highlights | AI-powered session summaries (“Highlights”) that watch sessions and surface the moments that matter so teams don’t have to manually review replays end-to-end. | ||
| Insights delivered to workflows | Get Galileo insights delivered in existing workflows, including Slack, Microsoft Teams, and via webhooks. | ||
| Pixel-perfect session replay | 100% accurate reproduction and playback of user sessions across web and native mobile apps, exactly as the user saw it. | ||
| Go Live playback | Jump from a replay to a live view for currently-active users to support real-time debugging and support interactions. | ||
| Replay + dev telemetry | Session replay includes DOM playback plus console and network logs, errors, and performance data for in-depth debugging. | ||
| Filters & search | Search for sessions by user information, errors, URLs, and 50+ other options; combine filters to create cohorts used throughout LogRocket. | ||
| Auto Capture | Capture every event, page, and action with “no tagging needed,” so teams can answer analytics questions without code changes. | ||
| Definitions | Define events in common language so teams can reuse consistent event naming and meaning across charts and dashboards. | ||
| Conversion funnels + insights | Build conversion funnels to find drop-off, then use AI-powered funnel insights and session replay to understand what happened before users abandon. | ||
| Path analysis | Analyze the routes users take through your app, where they drop off, and what issues they experience along the way. | ||
| Cohort analysis | Create cohorts based on behavior, traits, metadata, or any combination of filters, and apply cohorts across charts. | ||
| Retention charts | Track retention and identify the actions that make users more likely to convert and become repeat users. | ||
| Dashboards & templates | Use out-of-the-box dashboards for common use cases or build custom dashboards tailored to your team’s KPIs. | ||
 Twilio Segment 30
features | Sources (Analytics API) | Collect first-party user events from any platform using Segment’s Analytics API (web, mobile, server, and more). | |
| Destinations (700+ connectors) | Send customer data to 700+ downstream tools with “just a few clicks,” without building each integration yourself. | ||
| Turn on tools fast | Activate new tools “in minutes, not weeks,” without needing to push code or wait for App Store approvals (even for tools without their own mobile SDKs). | ||
| Reverse ETL | Sync data from your warehouse to your applications and destination tools to activate warehouse data across your stack. | ||
| Functions | Build custom integrations, transformations, and data-masking logic with lightweight JavaScript on Segment’s extensible platform. | ||
| Functions Co-Pilot (AI) | Generate complete Functions from natural language prompts and get AI recommendations to optimize existing Functions. | ||
| Debugger (live event stream) | View a live stream of event data flowing from your app to Segment to speed up implementation and troubleshooting. | ||
| Replays | Replay existing data to try new tools quickly and reduce vendor lock-in. | ||
| Tracking Plan | Create a shared, living Tracking Plan to align teams around a single data dictionary instead of spreadsheets. | ||
| Data Validation | Automatically audit your instrumentation with real-time validation to catch incorrect properties or data types at scale. | ||
| Violation reporting | Get in-app reporting and daily email digests so teams can quickly take action on invalid events. | ||
| Typewriter + Protocols API | Reduce implementation errors with Typewriter and an extensible API for Protocols. | ||
| Data Controls (block & quarantine) | Enforce data standards by blocking non-conforming events and reviewing discrepancies in a separate quarantine source. | ||
| Identity Resolution (deterministic) | Stitch together customer journeys across sessions and devices with deterministic identity resolution to build unified profiles. | ||
| Unified customer profiles | Automatically match and merge data from streaming sources (including the warehouse) into unified, always up-to-date customer profiles. |
Table Stakes Features
Features that 50%+ of competitors of posthog.com offer. These are baseline buyer expectations.
Table-stakes features
Features 50%+ of competitors have
You're missing
Add these to your roadmap
AI assistant & insights
AI


Autocapture event tracking
Analytics
Dashboards & reporting
Reporting

Segmentation & cohorts
Analytics
Journeys & path analysis
Analytics
Session replay
Replay
Replay privacy controls
Privacy
Warehouse sync & connectors
Data
Alerts & anomaly monitoring
Monitoring
Workflow automation
Workflow
Issue detection & errors
Observability
Differentiator Features
Unique features that only 1-2 competitors of posthog.com offer. These are potential competitive advantages.
Differentiator features
Unique to 1-2 entities only
Your differentiators
Features that set you apart
Identity resolution & profiles
Identity
Pricing Landscape
How competitors of posthog.com price their products
 You
YouFree
- ✓ No credit card required (free allowances reset monthly; no base subscription).
- ✓ Product Analytics: first 1,000,000 events/mo free.
- ✓ Surveys: first 1,500 survey responses/mo free.
Paid (usage-based)
- ✓ Starts at $0/mo base fee; you pay per-product usage (tiered volume discounts) and can set per-product billing limits/alerts to prevent overages.
- ✓ Product Analytics (events/mo): 1st 1M free; 1–2M $0.0000500 / event; 2–15M $0.0000343 / event; 15–50M $0.0000295 / event; 50–100M $0.0000218 / event; 100–250M $0.0000150 / event; 250M+ $0.0000090 / event.
- ✓ Surveys (responses/mo): 1st 1.5k free; 1.5k–2k $0.10 / survey response; 2k–10k $0.035; 10k–20k $0.015; 20k+ $0.010.
Add-ons

Starter
- ✓ 50K monthly tracked users (MTUs) and up to 10M events.
- ✓ Out-of-the-box analytics and templates.
- ✓ Session Replay.
Plus
- ✓ Starting at $49/month; pricing scales by Monthly Tracked Users (MTUs).
- ✓ Pricing calculator example (annual billing): 1K MTUs shows $582/year and $0.049 per MTU.
- ✓ Up to 300K MTUs or 25M events included.
Growth
- ✓ Custom pricing (Contact sales).
- ✓ Custom MTU/event volume; advanced behavioral analysis + causal insights/monitoring.
- ✓ Feature experimentation (incl. code editor for web experimentation).
Enterprise
- ✓ Custom pricing (Contact sales).
- ✓ Custom MTU/event volume; cross-product analysis.
- ✓ Advanced data + permission controls.
Add-ons

Free
- ✓ Free forever (no credit card required).
- ✓ Capped at 1M monthly events.
- ✓ 5 saved reports per seat.
Growth
- ✓ Starts at $0 with the first 1M monthly events free; then $0.28 per 1K events after (volume discounts available).
- ✓ Unlimited saved reports; billed by event volume (pricing calculator supports Monthly/Yearly).
- ✓ Up to 20M monthly events on Growth plan (per plan comparison table).
Enterprise
- ✓ Custom pricing (Contact Sales / “Let’s chat”).
- ✓ Unlimited monthly events (Enterprise is positioned for large-scale usage).
- ✓ Advanced governance & security features (e.g., SAML-based SSO & SCIM provisioning shown in plan table).
Startup Program (Startup Plan)
- ✓ Eligible startups get their first year free on the Startup Plan.
- ✓ Annual data limit: up to 1 billion events per year; valid for 12 months.
- ✓ No feature limits; includes advanced reports (e.g., Signal and Experiments).
Add-ons

Developer
- ✓ Free (no credit card required)
- ✓ 2M events per month
- ✓ Unlimited flag & config checks
Pro
- ✓ $150 /mo
- ✓ 5M events included, then $0.05 per 1K events
- ✓ Unlimited flag & config checks
Enterprise
- ✓ Custom pricing (event- or experiment-based contracts)
- ✓ Large volume discounts
- ✓ Warehouse native deployment
Add-ons

Free
- ✓ Core analytics charts
- ✓ Unlimited enrichment sources
- ✓ Guides integrations
Growth
- ✓ All features in Free
- ✓ Sense (Contentsquare’s AI) / AI Powered Assistant
- ✓ Unlimited users & reports
Pro
- ✓ All features in Growth
- ✓ Account analytics + engagement matrix
- ✓ Report alerts
Premier
- ✓ All features in Pro
- ✓ Data warehouse integration
- ✓ Behavioral targeting
Add-ons

Free
- ✓ Up to 500 monthly active users (MAUs)
- ✓ Product analytics / retroactive analytics
- ✓ In-app guides
Base
- ✓ Custom monthly active users (MAUs)
- ✓ Product analytics
- ✓ In-app guides
Core
- ✓ Everything in Base
- ✓ Custom monthly active users (MAUs)
- ✓ Product analytics
Ultimate
- ✓ Everything in Core
- ✓ Net promoter score (NPS)
- ✓ Product discovery
Add-ons

Developer
- ✓ Free forever (no credit card required).
- ✓ Unlimited seats.
- ✓ Unlimited feature flags.
Foundation
- ✓ Usage-based pricing: $12 per Service Connection / mo and $10 per 1k client-side MAU / mo (billed monthly or billed yearly).
- ✓ Unlimited seats.
- ✓ Everything in Developer, plus unlimited projects.
Enterprise
- ✓ Custom pricing (contact sales).
- ✓ Unlimited seats.
- ✓ Everything in Foundation, plus advanced user targeting.
Guardian
- ✓ Custom pricing (contact sales).
- ✓ Unlimited seats.
- ✓ Everything in Enterprise, plus Release Monitoring and Guardrail Metrics.
Add-ons

FullstoryFree
- ✓ 30,000 sessions per month.
- ✓ 10 user seats.
- ✓ 5,000 server-side events per month.
Business
- ✓ Essential product analytics and session insights.
- ✓ Positioned for teams needing deep product analytics and qualitative insights.
- ✓ Paid plan pricing is provided via “Request pricing & demo”.
Advanced
- ✓ Includes everything in Business.
- ✓ Adds advanced product analytics such as journeys and conversions.
- ✓ Positioned for discovering trends, planning roadmaps, and improving funnels at scale.
Enterprise
- ✓ Includes everything in Advanced.
- ✓ SSO and role-based permissions.
- ✓ Optional multi-org management.
Workforce
- ✓ Analytics for internal tools and applications.
- ✓ Positioned to transform digital employee experience (productivity/efficiency).
Add-ons

Free
- ✓ Up to 200k monthly sessions
- ✓ Session Replay and unlimited heatmaps
- ✓ Funnels + standard filters
Growth
- ✓ Pricing page shows $49 (pay monthly) or $39 with yearly toggle (=$468/yr if $39/mo billed annually)
- ✓ All features from Free
- ✓ Sense (Contentsquare’s AI) + Journey Analysis + Impact Quantification
Pro
- ✓ Price shown as “Let’s talk” (custom)
- ✓ All features from Growth
- ✓ Starts at 1m monthly sessions (per pricing page)
Enterprise
- ✓ Price shown as “Let’s talk” (custom)
- ✓ All features from Pro
- ✓ Digital Experience Monitoring + User Lifecycle Extension
Add-ons

Free
- ✓ Free forever ($0/month)
- ✓ Includes 1,000 sessions/month
- ✓ 1 month data retention
Team
- ✓ Starting at $69/month
- ✓ Pixel-perfect session replay
- ✓ JavaScript error reporting
Professional
- ✓ Starting at $295/month
- ✓ AI-powered struggle detection
- ✓ Detailed product analytics
Enterprise
- ✓ Custom pricing (Contact us)
- ✓ Conditional recording and custom session volume
- ✓ Self-hosted option available
Add-ons

Connections (Customer Data Pipeline) — Free
- ✓ $0/month; includes 1,000 visitors/mo.
- ✓ 500,000/mo Reverse ETL Records.
- ✓ 2 sources.
Connections (Customer Data Pipeline) — Team
- ✓ Starts at $120/month; includes 10,000 visitors/mo.
- ✓ +$10/mo for 1,000 monthly visitors (beyond included volume).
- ✓ 14-day free trial.
Connections (Customer Data Pipeline) — Business
- ✓ Custom pricing / custom volume.
- ✓ Single View of the Customer + Data Governance.
- ✓ Advanced Roles & Permissions.
Customer Data Platform (Connections + Unify + Engage)
- ✓ Contact sales / custom pricing.
- ✓ Unify events + warehouse data into governed, identity-resolved profiles.
- ✓ Build AI-powered audiences from a complete customer view.
Add-ons
Pricing Comparison
Normalized monthly pricing for competitors of posthog.com
Lowest Plan Price by Competitor
| Competitor | Plan | Original Price | Monthly Equivalent | Calculation |
|---|---|---|---|---|
★ You | Free | $0 | $0/mo | Free tier |
★ You | Paid (usage-based) | $0 | $0/mo | Already monthly |
| Starter | $0 | $0/mo | Free tier | |
| Free | $0 | $0/mo | Free tier | |
| Growth | $0 | $0/mo | Already monthly | |
| Growth | $0 | $0/mo | Annual ÷ 12 | |
| Startup Program (Startup Plan) | $0 | $0/mo | Annual ÷ 12 | |
| Developer | $0 | $0/mo | Free tier | |
| Free | $0 | $0/mo | Free tier | |
| Free | $0 | $0/mo | Free tier | |
| Developer | $0 | $0/mo | Free tier | |
| FullstoryFree | $0 | $0/mo | Free tier | |
| Free | $0 | $0/mo | Free tier | |
| Free | $0 | $0/mo | Free tier | |
| Connections (Customer Data Pipeline) — Free | $0 | $0/mo | Free tier | |
| Growth | $468 | $39/mo | Annual ÷ 12 | |
| Plus | $582 | $48.5/mo | Annual ÷ 12 | |
| Plus | $49 | $49/mo | Already monthly | |
| Growth | $49 | $49/mo | Already monthly | |
| Team | $69 | $69/mo | Already monthly | |
| Connections (Customer Data Pipeline) — Team | $120 | $120/mo | Already monthly | |
| Pro | $150 | $150/mo | Already monthly | |
| Professional | $295 | $295/mo | Already monthly | |
Reviews & Ratings
How competitors of posthog.com are rated on G2, Capterra, Trustpilot, and TrustRadius
| Competitor | G2 | Capterra | Trustpilot | TrustRadius |
|---|---|---|---|---|
| You | 4.5/5 1,021 reviews | Not listed | Not listed | Not listed |
4.5/5 2,693 reviews | 4.6/5 67 reviews | 1.8/5 45 reviews | 4.3/5 157 reviews | |
4.6/5 1,263 reviews | 4.5/5 144 reviews | 2.3/5 7 reviews | 4.2/5 251 reviews | |
4.7/5 345 reviews | 5.0/5 2 reviews | Not listed | Not listed | |
4.4/5 1,096 reviews | 4.5/5 42 reviews | Not listed | Not listed | |
4.4/5 1,561 reviews | 4.5/5 238 reviews | 3.2/5 2 reviews | 4.2/5 247 reviews | |
4.5/5 645 reviews | 4.7/5 24 reviews | 3.6/5 2 reviews | 3.9/5 54 reviews | |
4.5/5 867 reviews | 4.6/5 67 reviews | 2.6/5 4 reviews | 4.7/5 156 reviews | |
4.3/5 331 reviews | 4.6/5 538 reviews | 1.9/5 54 reviews | 4.0/5 357 reviews | |
4.6/5 2,248 reviews | 4.9/5 28 reviews | Not listed | Not listed | |
4.5/5 563 reviews | 4.7/5 72 reviews | 3.3/5 2 reviews | 4.2/5 110 reviews | |
Sentiment Themes
What customers love and hate about competitors of posthog.com
| Competitor | What Customers Love | Common Complaints |
|---|---|---|
| You |
|
|
|
| |
|
| |
|
| |
|
| |
|
| |
|
| |
|
| |
|
| |
|
| |
|
| |
Top Weaknesses to Exploit
Actionable competitor weaknesses with positioning suggestions for posthog.com
 Your Weaknesses to Address
These are weaknesses competitors might use against you. Consider addressing them in your product or messaging.
Users report slow loading, especially for Live Events and when applying filters.
"It takes a long time to load the Live events sometimes. "
- G2
"Whenever I try to apply filter… it keeps loading. "
- G2
How to defend against this
Lead with speed and reliability: demo fast query times on large datasets, share benchmarks, and highlight real-time views that stay responsive under heavy filtering.
First-time users can feel overwhelmed and struggle to build funnels or navigate the feature set.
"It is… difficult… for a first time user to create funnels and stuff. "
- G2
"Choice overload, but powerful tool. "
- G2
How to defend against this
Position “time-to-first-insight” and guided workflows: emphasize opinionated templates, in-product guidance, and a simpler information architecture for non-expert teams.
Some users hit workflow friction when exploring data (e.g., filters/versions) and need iteration to get what they want.
"Whenever I try to apply filter for app versions or release versions it keeps loading. "
- G2
"One thing is the loading issue. "
- G2
How to defend against this
Differentiate with analysis UX: highlight faster filtering, clearer segmentation, and smoother exploratory analysis (saved segments, versioned dashboards, and snappy cohorting).

Dashboards/navigation are a recurring pain point (limited dashboard capability; users report getting lost and calling dashboards weak).
"They have dashboards, but the dashboard functionality is limited."
- TrustRadius
"Dashboards are probably one of the weakest I have seen."
- Trustpilot
How to position against this
Lead with your dashboard UX: faster time-to-insight, clearer navigation, and “executive-ready” dashboards (plus side-by-side screenshots in competitive evals).
Teams cite gaps in integrations and workflow activation (hard to connect insights to downstream tools; cohort/ID workflows can be painful).
"Could be great to have more third-party integrations (e.g., with Insider) to trigger communications based on funnel drop-offs."
- TrustRadius
"Importing cohorts has been a pain because we need to convert to AmplitudeID’s a lot of the time."
- TrustRadius
How to position against this
Emphasize turnkey integrations and activation loops (CDP/marketing automation/CRM), and highlight simpler identity resolution + cohort sync/export story.
Users complain about slow report loading and heavy/over-detailed reports that delay analysis.
"Opening reports is very slow."
- Trustpilot
"Reports have too much extra (not needed) details that delay the opening of a report."
- Trustpilot
How to position against this
Differentiate on speed and “lightweight by default” reporting: fast queries, quick-loading charts, and controls to hide expensive breakdowns/details.

Steep learning curve and an interface that can overwhelm new users slows time-to-value.
"UI can be overwhelming for new users. "
- G2
"Its initial learning curve can be quite challenging. "
- G2
How to position against this
Lead with “fast time-to-first-insight”: guided setup, opinionated templates, in-product tours, and role-based default dashboards (PM/Marketing/Eng).
Identity resolution and setup sensitivity can create duplicate users or misleading results (trust in data suffers).
"Multiple users get created despite identity merge being enabled. "
- Capterra
"There are instances when there are errors in the data that have been gathered… due to setup not being correct. "
- Capterra
How to position against this
Position stronger “data confidence”: automated QA checks, identity debugging tools, guardrails, and clearer instrumentation validation (plus proactive alerts on anomalies/duplication).
Custom reporting and exporting granular/raw data can feel limited or cumbersome.
"Limitations on creating custom reports… the Excel sheet cannot fit all data into one sheet. "
- Capterra
"Exporting raw data from Mixpanel can be restrictive. "
- G2
How to position against this
Differentiate on openness: one-click raw export, flexible report builder, warehouse-native querying, and easy scheduled deliveries to BI/Sheets without workarounds.

Bot traffic can contaminate experiment exposure data; detection may require manual effort.
"One area where Statsig could improve is identifying bot traffic more effectively; we’ve observed some experiment exposures coming from bots."
- G2
"We had to proactively report these cases to help improve detection."
- G2
How to position against this
Lead with built-in bot filtering, automated anomaly detection, and guardrails that keep experiments clean without manual reporting.
Analysis workflows can feel opinionated and less suited for deep exploratory work.
"The UI and analysis workflows can feel opinionated and less flexible for deep, exploratory analysis."
- G2
How to position against this
Position your product as more flexible for ad-hoc exploration (custom slices, pivots, notebooks/SQL, and exports) while still offering guided workflows.
Complex implementations may require time investment and lack turnkey templates for advanced patterns (e.g., multi-tenant).
"You need to invest time to learn the system to unlock the most value from the platform."
- G2
"I’d like to see turnkey templates for more complicated setups such as multi-site/tenant."
- G2
How to position against this
Differentiate with faster time-to-value: opinionated quick-start templates, guided setup for common architectures (multi-tenant/multi-project), and white-glove onboarding.

Perceived as expensive (especially for small businesses) with requests for cheaper tiers and clearer pricing predictability.
"The cost of the tool can be a lot higher for small businesses. "
- Capterra
"For small enterprises Heaps pricing could be unpredictable as it doesn't offer clear public pricing. "
- TrustRadius
How to position against this
Lead with transparent pricing, predictable billing, and an SMB-friendly tier; quantify time-to-value so the ROI case is simpler.
Users report a learning curve and UI/analysis controls that can feel confusing or not smooth.
"I find Heap to be very difficult to learn... different data parameters... are confusing and seem to overlap. "
- G2
"Cons: Not so efficient overall product interface. The backend UI of the tool is not so smooth. "
- Capterra
How to position against this
Differentiate on usability: show a 5-minute dashboard build, opinionated templates, and guided workflows that reduce analysis complexity for new users.
Some reviewers call out slow customer support response times.
"The customer support is a little slow at responding. "
- Capterra
"Customer support takes too long to respond to our emails. "
- Capterra
How to position against this
Emphasize fast support SLAs, live chat/priority support, and proactive onboarding (named CSM, office hours) to reduce time-to-resolution.

Steep learning curve; some tasks feel roundabout/overwhelming for teams under time pressure.
"It takes too long to learn to do even basic things as some procedures seem very roundabout."
- Trustpilot
"There is a lot going on in Pendo; this makes it a very powerful tool, but it can be a little overwhelming."
- TrustRadius
How to position against this
Position your product as faster time-to-value: simpler IA, fewer steps for common tasks, and guided setup/checklists that get teams to useful insights in the first week.
Some users want deeper analytics and richer session diagnostics (e.g., rage clicks) vs specialized tools.
"Analytics side isn’t as robust as the likes of Amplitude."
- Capterra
"I wish it had some more functionality to actually see users sessions and track like rage clicks."
- Capterra
How to position against this
Differentiate with best-in-class behavior analytics/session replay (rage clicks, error correlation, funnel drop-off diagnostics) and make these capabilities first-class (not add-ons).
Pricing can be perceived as high/poor value, especially when combined with setup effort.
"Hard to use, unreasonable price"
- Trustpilot
"Powerful In-App Guidance & Analytics, but Pricing and Setup Can Feel Overwhelming"
- G2
How to position against this
Compete with transparent packaging (clear tiers), lower-cost entry plans, and bundle key features customers complain about paying extra for (e.g., replay/advanced analytics) into a single plan.

Approval and change-management workflows are still maturing (e.g., mandated change requests/approvals).
"The workflow/approval features are a bit green but improving. "
- TrustRadius
"Add an option to mandate change requests. "
- TrustRadius
How to position against this
If you compete here, lead with “enterprise governance”: multi-step approvals, mandatory change tickets, audit trails, and policy-as-code controls for releases.
Granular roles and security controls are cited as areas needing improvement.
"Could be easier to define Custom role creation. "
- TrustRadius
"Add more security features when we deal with production code. "
- TrustRadius
How to position against this
Differentiate with fine-grained RBAC (custom roles/permissions), strong separation-of-duties, and compliance features (SCIM/SSO, audit exports, admin safeguards).
Users call out gaps in lifecycle operations: alerts/notifications, and promoting flags across environments cleanly.
"We need some notification based alerts while dealing with production environment. "
- TrustRadius
"The ability to create a feature flag in one environment and publish to others. "
- TrustRadius
How to position against this
Emphasize “operational excellence”: built-in alerting (Slack/PagerDuty), clean env promotion/templating, and automated stale-flag cleanup to reduce tech debt.

Perceived as expensive, with some reviewers calling out steep price increases/minimums.
"Price for minimum package was increased from USD $199 to $899."
- Capterra
"I never really used all the functionalities it offers because the price is insane high."
- TrustRadius
How to position against this
Lead with transparent pricing, an accessible entry tier, and a clear cost-to-value story (e.g., ROI calculator + migration offer + “no surprise renewals / no high minimums” messaging).
Some users report slow/failed session loading and imperfect replay reconstruction (and UI elements like iframes/dropdowns).
"Sometimes it won't load sessions it seems like this happens when you need it most."
- Capterra
"Occasionally, the reconstructed videos of user behavior are misleading."
- Capterra
How to position against this
Differentiate on reliability (fast playback, fewer gaps), clearer “confidence indicators” for replay accuracy, and better handling of complex web elements (iframes, dropdowns) in demos.
Steeper learning curve and some reporting/tracking limitations for specific workflows (e.g., multi-step actions).
"The learning curve is pretty steep."
- G2
"I wish I could better capture and track data of two interactions."
- G2
How to position against this
Position as “faster time-to-insight”: simpler onboarding, opinionated templates (funnels/journeys), and first-class support for multi-step tracking/reporting; back it up with a 15-minute setup demo and guided trial.

Users report poor/slow support and lack of a human or phone-based escalation path.
"No way to speak to a human, just a chatbot. "
- Trustpilot
"Worst support experience so far. "
- Trustpilot
How to position against this
Lead with “human support + clear SLAs” (e.g., live chat with real agents, priority escalation, and documented response times) and highlight onboarding/implementation help.
Frustration with upsell/upgrade pressure, restrictive tiers, and perceived poor value at higher plans.
"Endless in app upgrade cycle even if you are already paying subscription fees. "
- Trustpilot
"Limited plan tiers restrict the number of recordings available. "
- TrustRadius
How to position against this
Differentiate with transparent packaging, generous session limits, and a pro-rated downgrade/refund policy; provide a simple “no surprise limits” comparison table.
Reviewers cite friction analyzing recordings (filtering, accuracy, stuck sessions), which undermines day-to-day usability.
"The filtering of the recordings can be done better. "
- TrustRadius
"Sometimes the recordings get stuck and we can't see the full journey of a user. "
- TrustRadius
How to position against this
Emphasize reliability (no stuck sessions), advanced filtering/segmentation, and “time-savers” (auto-highlights, issue detection, or summaries) that reduce review workload.

Cost can push teams to consider alternatives or wish for a mid-tier plan.
"I love using this tool but may have to find a different tool because of price "
- Capterra
"Users suggest adding a mid-tier pricing option for smaller businesses that want advanced metrics without the enterprise plan. "
- TrustRadius
How to position against this
Lead with a clear, predictable pricing story (especially for session-based costs), and emphasize an affordable plan that still includes the core “replay + debugging” workflow.
Retention/archiving limits can block long-term benchmarking and investigations of older issues.
"The main issue we have is the data not archiving/being accessible after a month. It would be helpful if we could access user sessions even 6 months back. "
- G2
How to position against this
Differentiate on longer default retention (or lower-cost retention upgrades), and highlight how customers can reliably investigate issues weeks/months later.
Some users report a learning curve for advanced capabilities and UX papercuts (e.g., missing dark mode).
"When I started using the platform, there was a bit of a learning curve. I had to spend time searching through documentation to learn how to use some advanced features. "
- G2
"There’s no dark mode in the UI, which is very bad for a developer audience. "
- G2
How to position against this
Position your product as faster-to-value with guided onboarding, better in-product discoverability for advanced features, and strong “developer-quality-of-life” UX (including dark mode if you have it).

Customers frequently call out Segment’s cost as high and/or unpredictable (usage/MTU-driven), especially with many (anonymous) users.
"It is pricy: the cost is based on the average number of single users tracked per month and it's not cheap at all. "
- Capterra
"The pricing model (MTUs) when you have a lot of anonymous users can be a problem. "
- Capterra
How to position against this
Lead with predictable pricing (clear tiers, usage caps, generous free/anonymous allowances) and show a modeled cost comparison for their traffic/profile mix.
UI complexity and event governance (taxonomy design) can be painful; working in the event feed/debugging can be cumbersome.
"They can definitely improve on the user interface. "
- Capterra
"Initial implementation and event taxonomy design are hard to get right, and mistakes are expensive long-term. "
- G2
How to position against this
Differentiate with guided onboarding (templates, linters, governance checks), stronger in-product ergonomics (search/filtering), and opinionated best-practice schemas.
Reviewers ask for stronger native reporting and sometimes better responsiveness on customer queries.
"Reporting capabilities need more advanced features. "
- TrustRadius
"Customer service could be more efficient on their end for customer queries. Cheaper price point. "
- TrustRadius
How to position against this
Emphasize built-in analytics/reporting (or best-in-class embedded BI) plus explicit support SLAs (fast response, solution architects) for implementation and ongoing governance.
Review Quotes
Real customer quotes about competitors of posthog.com
Sales Ammo
YouWhat Customers Say (Pros)
"Creating dashboards to visualise the data and app usage patterns is very easy. "
- G2
"It is straightforward to track the actions performed on the app and which feature is most widely used. "
- G2
"Creating dashboards, Funnels and Live events… Easy to use tool. "
- G2
"The session recording and export data helps us keep a record of all the testing we do. "
- G2
"Easy to track quality metrics on daily basis. "
- G2
"I am able to view the events logged by the mobile applications easily. "
- G2
"Easiest analytics platform I've ever used. "
- G2
What Customers Say (Cons)
"It takes a long time to load the Live events sometimes. "
- G2
"PostHog is still slow… it keeps loading. "
- G2
"It is also a bit difficult to understand for a first time user to create funnels and stuff. "
- G2
"Choice overload, but powerful tool. "
- G2
"Whenever I try to apply filter for app versions or release versions it keeps loading. "
- G2
"One thing is the loading issue. "
- G2
What Customers Say (Pros)
"Their free plan is very extensive, so even small teams and startups can use it for free for a long time."
- Trustpilot
"Amplitude helps us find hidden user patterns in terms of pain points or success, so we can iterate and improve our product based on data."
- TrustRadius
"We used to need to create different dashboards for different markets we operate in; now it’s just one click away."
- TrustRadius
"You can always get up-to-date usage data on all of our users; it’s down to the minute information with basically no delays."
- TrustRadius
"The charts are simple and intuitive."
- TrustRadius
"The average marketer can use it and get the information they need without needing any technical work done."
- TrustRadius
"The dashboard is very well implemented and designed with good features."
- Trustpilot
What Customers Say (Cons)
"Could be great to have more third-party integrations (e.g., with Insider) to trigger communications based on funnel drop-offs."
- TrustRadius
"Events can be unreliable as software updates and changes; sometimes they can stop triggering and it’s not immediately acknowledged."
- TrustRadius
"Importing cohorts has been a pain because we need to convert to AmplitudeID’s a lot of the time."
- TrustRadius
"They have dashboards, but the dashboard functionality is limited."
- TrustRadius
"Dashboards are probably one of the weakest I have seen."
- Trustpilot
"Opening reports is very slow."
- Trustpilot
"The UI dashboard has a lot of info and is easy to get lost in."
- Trustpilot
"Communication was confrontational rather than constructive, and when issues were raised, the response was defensive instead of accountable."
- Trustpilot
What Customers Say (Pros)
"Mixpanel is a very flexible data collection and analysis tool."
- G2
"Extremely easy to setup instrumentation and quickly build dashboards to track user behavior."
- G2
"Easy to use, a lot of great docs and tools for learning how to leverage, good options for data visualization."
- G2
"Mixpanel enabled us to easily test whether a new module was providing value, based on the actual activities of our users."
- Capterra
"It is a very intuitive tool, and in minutes, you can obtain fascinating graphs and results."
- Capterra
"Mixpanel has been reliable. Mixpanel is easy to use."
- Capterra
"Mixpanel stores and displays user engagement and event data really well which lets us visualize the effective…"
- TrustRadius
What Customers Say (Cons)
"UI can be overwhelming for new users."
- G2
"AB testing needs improvement."
- G2
"Exporting raw data from Mixpanel can be restrictive."
- G2
"Sometimes due to technical issues, multiple users get created despite identity merge being enabled."
- Capterra
"There are limitations on creating custom reports; the Excel sheet cannot fit all data into one sheet."
- Capterra
"There are data privacy concerns."
- Capterra
"There are instances when there are errors in the data that have been gathered… (often due to setup not being correct)."
- Capterra
What Customers Say (Pros)
"Feature gates, A/B testing, test setup, and analytics are all in one place."
- G2
"Experiment setup feels simple and intuitive, making it easier to run experiments quickly."
- G2
"It’s easy to verify exposures using overrides and diagnostics, which helps with confidence in rollouts."
- G2
"Custom metrics are straightforward to define, and analysis is strong when breaking down by user dimensions."
- G2
"Fast, reliable experimentation: feature flags, A/B tests, and impact measurement work well at scale with strong statistical rigor."
- G2
"It helps you grasp concepts like significance and confidence intervals at a glance, making it easier to communicate results to stakeholders."
- G2
"It’s flexible enough for our needs without extensive integration requirements."
- G2
"It replaced two other products for us (Mixpanel and LaunchDarkly) as a centralized experimentation platform."
- TrustRadius
What Customers Say (Cons)
"Bot traffic identification could be stronger; we’ve seen some experiment exposures coming from bots."
- G2
"We had to proactively report bot-exposure cases to improve detection, which adds overhead."
- G2
"The UI and analysis workflows can feel opinionated and less flexible for deep, exploratory analysis."
- G2
"Advanced use cases still require engineering input."
- G2
"You need to invest time learning the system to unlock the most value from the platform."
- G2
"Docs and support are helpful, but we’d like more turnkey templates for complex setups (e.g., multi-site / multi-tenant)."
- G2
What Customers Say (Pros)
"Heap is incredibly easy to use without specialized knowledge. I can build a chart or dashboard in minutes. "
- G2
"I don't need to consider what I'll need to measure in future — I can simply log in, search for the event I'm interested in, and see how our users are using it. "
- G2
"Heap tracks every user event out-of-the-box and doesn't require custom labeling, it has a low maintenance cost for tags. "
- Capterra
"Easy to implement and setup. It makes it easy for almost everybody at my workplace... to be able to review data provided, even without being tech savvy. "
- Capterra
"The clean interface and visually appealing dashboards made it easier for me to understand the data. "
- Capterra
"Heap's implicit tracking and visualizer make it much easier to add and analyze events. Historical events can also be analyzed. "
- TrustRadius
"Robust automated analysis of customer behavior and interests helps make the necessary changes. "
- TrustRadius
What Customers Say (Cons)
"The cost of the tool can be a lot higher for small businesses. "
- Capterra
"Cons: Not so efficient overall product interface. The backend UI of the tool is not so smooth. "
- Capterra
"The customer support is a little slow at responding. "
- Capterra
"Customer support takes too long to respond to our emails. "
- Capterra
"Limited analytics. Difficult to set up and charting capabilities/dashboards can be improved. "
- Capterra
"I have used other data analytics platforms like Looker, Split and FullStory, and I find Heap to be very difficult to learn. Some of the different data parameters... are confusing and seem to overlap. "
- G2
"It has certain limitations and can't be used for split testing results tracking, nor for absolute numbers. "
- G2
"Offer a cheaper price plan. "
- TrustRadius
What Customers Say (Pros)
"Enables us to be product led, where we can rely on actual data rather than opinion."
- TrustRadius
"Having in-app guidance, robust analytics, session replays, and feedback tools all in one platform provides deep visibility into where people may be getting stuck."
- G2
"Analytics always gave me insights that I needed."
- G2
"The dashboard is great because I can see all the stats at once without having to do anything special."
- G2
"The documentation is well diversified and easy to use, making it simple to set up the API and get started without any problems."
- G2
"Pendo helped us with user onboarding by pointing out what’s confusing and where users abandon."
- Capterra
"It is great that all the analytics are presented on dashboards that include organized tables and graphs, and we can easily include them in our presentations."
- Capterra
"The onboarding sessions were very helpful."
- Capterra
What Customers Say (Cons)
"Hard to use, unreasonable price"
- Trustpilot
"It takes too long to learn to do even basic things as some procedures seem very roundabout."
- Trustpilot
"Setting up a step-by-step guide inside an app seemed quite a counterintuitive and repetative task."
- Trustpilot
"Pendo's own tutorial videos are a mixed bag."
- Trustpilot
"Analytics side isn’t as robust as the likes of Amplitude."
- Capterra
"It can be a bit tricky to tag up elements when your app evolves frequently."
- Capterra
"We had to get into the code and it was a little convoluted and difficult to set up"
- Capterra
"It is confusing to filter and know what user activity I am viewing."
- Capterra
What Customers Say (Pros)
"We have been using LaunchDarkly more than a year now and the services, and the customer service, are outstanding. "
- Trustpilot
"It helps you in creating one code branch and use it with feature flag, that's how it improves the team productivity. "
- TrustRadius
"LaunchDarkly provides a clear insight into the state of your toggles in production. "
- TrustRadius
"We use LaunchDarkly to help hide incomplete features from end users. This allows us to deploy code to production more often, which reduces code conflicts and leads to a healthier codebase. "
- TrustRadius
"It's hard to imagine building applications without LaunchDarkly - it's become an integral part of our deployment process. "
- TrustRadius
"The support team is excellent in providing immediate support while setting up the tool and during development. "
- TrustRadius
"LaunchDarkly's rule-based targeting is a game changer. "
- TrustRadius
"Awesome, responsive customer service team. User friendly UI. "
- TrustRadius
What Customers Say (Cons)
"They send you messages on LinkedIn saying they'll send you a $75 voucher to book a meeting with them... and don't follow up with their promise... They need to stop misleading people like this. "
- Trustpilot
"Customer support at times is hard to work with. "
- TrustRadius
"The ability to create a feature flag in one environment and publish to others. "
- TrustRadius
"We need some notification based alerts while dealing with production environment. "
- TrustRadius
"Could be easier to define Custom role creation. "
- TrustRadius
"Would like to see more analytics. "
- TrustRadius
"The workflow/approval features are a bit green but improving. "
- TrustRadius
"Add an option to mandate change requests. "
- TrustRadius
What Customers Say (Pros)
"It is one of the most useful software products I've ever encountered for B2B SaaS companies to quickly level up their product and sales performance 10X."
- Capterra
"The session recording features it has seemed far superior to any other product on the market that I have used or considered."
- Capterra
"Once my company got FullStory, I couldn't imagine a world without it."
- Capterra
"FullStory has a neat RageClick tracking feature. 10/10 would recommend."
- Capterra
"It removes a lot of the pain points and friction of traditional analytic capture and streamlines the results for easy consumption."
- G2
"Fullstory has been the easiest platform to integrate into our complex website tech stack."
- G2
"Full story has a super light weight feel to the system and works magically."
- TrustRadius
"FullStory helps us understand our user behaviors and identify bugs!"
- TrustRadius
What Customers Say (Cons)
"Price for minimum package was increased from USD $199 to $899."
- Capterra
"Sometimes it won't load sessions it seems like this happens when you need it most."
- Capterra
"Their support isn't the greatest. They are ridiculously expensive."
- Capterra
"It takes a few seconds to load the video, so I miss the action I was trying to look at."
- Capterra
"Occasionally, the reconstructed videos of user behavior are misleading."
- Capterra
"One serious issue is the inability to see iframes."
- Capterra
"The learning curve is pretty steep. Several instructor-led and on-demand training were needed to get the researchers and design team members fully onboarded."
- G2
"I used FullStory for the past 4 years and I loved it, but I never really used all the functionalities it offers because the price is insane high."
- TrustRadius
What Customers Say (Pros)
"It helped us a lot in the development of our Shopify store. Easy to integrate into our store. "
- Capterra
"Heatmaps help us understand the website experience which the users get. "
- Capterra
"Easy to set up. Useful to see what our user do on website or application. "
- Capterra
"Easy to use. The platform is intuitive and you can easily set it up. "
- TrustRadius
"Sessions recordings are great to see in detail, and I love the timestamps on the session timeline. "
- TrustRadius
"Remove assumptions by providing in the moment, contextual insights. "
- TrustRadius
"Heatmaps give us a visual representation of the user journey. "
- TrustRadius
"Support responded in a few minutes and resolved our problem in a matter of moments. "
- Trustpilot
What Customers Say (Cons)
"No way to speak to a human, just a chatbot. "
- Trustpilot
"If you cancel the day your sub renews, they will refuse to refund you. "
- Trustpilot
"It has fallen into the endless in app upgrade cycle even if you are already paying subscription fees. "
- Trustpilot
"The support is non-existent... email and no-one responds. "
- Trustpilot
"My $99/month plan is supposed to capture 500 sessions/day. It doesn't and... I get no reply. "
- Trustpilot
"The filtering of the recordings can be done better. "
- TrustRadius
"The automatic screenshots are not always accurate. "
- TrustRadius
"Sometimes the recordings get stuck and we can't see the full journey of a user. "
- TrustRadius
What Customers Say (Pros)
"Onboarding Specialist loves having a peek behind the curtains! "
- G2
"Perfect tool for funnel conversions and finding defects "
- G2
"Essential Debugging Tool with Robust Security Features "
- G2
"Effortless Integration and Powerful User Insights "
- G2
"LogRocket is amazing to debug production issues, and session recordings include logs and network requests. The app is clean and easy to use, and implementation is even simpler. "
- G2
"Providing deep insights into the data it collects through powerful visualizations and analytics for daily analysis and debugging "
- Capterra
"It’s easy to navigate and critical to seeing how users interact across our site. "
- Capterra
"Mainly used to debug issues for users before escalating to engineering; seeing the user’s point of view is incredibly valuable. "
- TrustRadius
What Customers Say (Cons)
"When I started using the platform, there was a bit of a learning curve. I had to spend time searching through documentation to learn how to use some advanced features. "
- G2
"The main issue we have is the data not archiving/being accessible after a month. It would be helpful if we could access user sessions even 6 months back. "
- G2
"There’s no dark mode in the UI, which is very bad for a developer audience. "
- G2
"With most of my team being experienced in other tools, training them to use this was trouble. "
- Capterra
"I love using this tool but may have to find a different tool because of price "
- Capterra
"Users suggest adding a mid-tier pricing option for smaller businesses that want advanced metrics without the enterprise plan. "
- TrustRadius
"Filtering issues can make reporting harder than it needs to be. "
- G2
What Customers Say (Pros)
"Segment is a reliable customer data platform that helped us scale. Using Segment throughout the years has saved us the time required to connect and sync data between tools. Easiness of use, perfect documentation and the ability to debug events in Segment makes it the perfect tool. "
- G2
"Exceptional product, with amazing support! Segment makes data collection incredibly easy. "
- G2
"Segment connects to all the various platforms that we're using which makes it very easy to send data around. No engineering needed. "
- G2
"It gives you a single, clean pipeline for collecting, standardizing, and activating user data across all touchpoints, without engineering bottlenecks. "
- G2
"Easy to use, amazing documentation, unparalleled functionality, and stellar support. "
- Capterra
"Set up was trivial, the API is easy to use and the real-time debugger is absolutely excellent. "
- Capterra
"Twilio Segment is an essential tool in our organization for managing customer data and streamlining communication across various platforms. It allows us to collect, clean, and control our customer data efficiently. "
- TrustRadius
What Customers Say (Cons)
"Pricing could be a bit more affordable, especially if you want to use ETL processes. "
- G2
"No built in CRM, pricey, many alternatives touting to offer the same thing now. "
- G2
"Initial implementation and event taxonomy design are hard to get right, and mistakes are expensive long-term. "
- G2
"They can definitely improve on the user interface. "
- Capterra
"The feed of events can be a bit difficult to filter through when testing new events. "
- Capterra
"It is pricy: the cost is based on the average number of single users tracked per month and it's not cheap at all. "
- Capterra
"The pricing model (MTUs) when you have a lot of anonymous users can be a problem. "
- Capterra
"Usage-based pricing models could help accommodate the budgets. Reporting capabilities need more advanced features. "
- TrustRadius
Social Proof Audit
Social proof elements used by competitors of posthog.com
| Competitor | Case Studies | Testimonials | Customer Claim | Notable Customers |
|---|---|---|---|---|
| You | - | - | 98% of our customers use PostHog for free. | Webshare , Supabase , Hasura , 4DayWeek , RayFit +2 more |
| - | - | “~3,000 customers and 26% of the Fortune 100 use Amplitude” and “more than 2,300 enterprises and 28 of the Fortune 100 choose Amplitude.” | Ford, NBC, Atlassian, Walmart, Rocket Money +5 more | |
| - | - | Join over 29,000+ companies who accelerated their growth with Mixpanel. | Wise , Yelp , Buffer , Vodafone Oman , Banglalink +5 more | |
| - | - | 3.5M+ customers benefitting from experimentation | OpenAI , Notion , Brex , HelloFresh , Webflow +5 more | |
| - | - | Join 14,000+ teams building with Pendo | Demandbase , Okta , Morgan Stanley , LastPass , OpenTable +5 more | |
| 39 | - | Trusted by 5,500+ customers; 25% of Fortune 500 are LaunchDarkly customers. | Paramount, Dior, Bayer, HP, Savage X Fenty +5 more | |
| 12 | - | Over 3,000 companies create data with Fullstory | Chipotle , Pizza Hut , Finicity , Yankee Candle , Vivid Seats +5 more | |
| - | 4 | Trusted by 1,306,323 websites in 180+ countries. | InVision, Reed.co.uk, HubSpot Academy, Unbounce, Matalan +5 more | |
| - | - | 3,000+ trusted customers | 7-Eleven , ShipStation , Speedway Motors , Dutchie , Prefect +5 more | |
| 24 | 5 | “Join the 25,000+ companies using the Segment platform” / “25,000+ brands building with Twilio Segment.” | Domino’s , Intuit , IBM , AB InBev , DigitalOcean +5 more | |
Metrics & Claims
 You
You- • Install with AI in 90 seconds.
- • Product Analytics free tier: 1 million events/mo.
- • Webshare boosted conversion by 26% (A/B experiment).
- • Hasura improved conversion rates by 10–20%.
- • Phantom cut failure rates by 90% (and aimed to keep failure rates at 1% or below).
- • “11K digital products served.”
- • “174% YOY growth.”
- • “6 months time to payback.”
- • “217% ROI over 3 years.”
- • “$10M in additional revenue expected annually at Rocket Money.”
- • Customer logos displayed on homepage: null (could not be determined from available page extracts).
- • 3X improvements on NPS since 2019.
- • 242M product questions answered per year by Mixpanel users.
- • 97.2% customer satisfaction score across all support experiences.
- • Neon: 1,400 experiments, leading to a 168% increase in revenue.
- • 1+ Trillion events processed per day
- • 2.5 Billion unique monthly experiment subjects
- • 99.99% infra uptime for API & Console
- • <1ms post-init evaluation latency
- • Increased donations by 51%, generating $123M for non-profits (Every.org)
- • Pendo has collected 35 trillion events
- • 40% increase in sales opps
- • 99% decrease in development time
- • 60% reduction in support ticket resolution time
- • 15B+ events processed daily
- • 45 trillion feature flags evaluated daily.
- • 40 trillion daily evaluations.
- • Sub-200ms flag updates.
- • 84% more frequent deployments.
- • Showing 39 of 39 results (success stories listing).
- • Chipotle reclaims over 71% of lost revenue
- • Pizza Hut increases total transactions by 6.5%
- • Finicity increases funnel conversions by 15%
- • Vivid Seats saved 10K conversions per error thanks to faster detection and fixes
- • TBC increases conversation rate by 145%
- • Trusted and used by 1.3+ million websites and apps.
- • 56,549 users signed up last month.
- • 5,750 UX designers log in to Hotjar every week.
- • Over 402 million people from 180 different countries have left feedback via Hotjar Surveys.
- • Customer Love page appears to display 4 testimonial quotes (counted from the page text: InVision, Reed.co.uk, HubSpot Academy, Unbounce).
- • 3.5bn+ sessions captured
- • 46 hours saved per week
- • 15 minutes to diagnose issues
- • 32% increased conversion
- • 0.5% issue rate after LogRocket
- • Homepage shows 9 customer logos in the “Join the 25,000+ companies…” logo strip.
- • Customer stories page shows 10 customer logos in the “25,000+ brands building with Twilio Segment” logo strip.
- • “700+ pre-built integrations” (enable “with the flip of a switch”).
- • “12.1 Trillion API calls processed in 2023” (site footnote shows stats from 6/30/22–6/30/23).
- • Domino’s story: “65% decreased cost per acquisition.”
SEO Category Ownership
Who dominates each topic for competitors of posthog.com
| Category | Leader | Runner Up | Total ETV | Gap |
|---|---|---|---|---|
Business & Industrial 10 competitors | Amplitude $160,167
ETV | Fullstory $125,630
ETV | $531,904 | 22% |
Computers & Consumer Electronics 10 competitors | Amplitude $115,817
ETV | Statsig $76,973
ETV | $373,981 | 34% |
Computers 10 competitors | Amplitude $104,673
ETV | Statsig $74,848
ETV | $345,962 | 28% |
Software 10 competitors | Amplitude $102,748
ETV | Statsig $72,818
ETV | $334,280 | 29% |
Business Management 10 competitors | Fullstory $73,418
ETV | Amplitude $39,666
ETV | $191,844 | 46% |
News, Media & Publications 9 competitors | Amplitude $70,997
ETV | Fullstory $43,011
ETV | $191,348 | 39% |
Business & Productivity Software 9 competitors | Amplitude $77,535
ETV | Statsig $60,219
ETV | $175,714 | 22% |
Advertising & Marketing 8 competitors | Fullstory $70,560
ETV | Amplitude $26,119
ETV | $151,127 | 63% |
Market Research 8 competitors | Fullstory $67,620
ETV | Amplitude $18,488
ETV | $125,789 | 73% |
Reference Materials & Resources 6 competitors | Amplitude $46,563
ETV | Fullstory $38,845
ETV | $122,233 | 17% |
Scientific Software 2 competitors | Amplitude $60,608
ETV | Statsig $55,518
ETV | $116,126 | 8% |
Scientific Equipment & Services 2 competitors | Statsig $57,663
ETV | Amplitude $49,563
ETV | $107,226 | 14% |
Internet & Telecom 9 competitors | LogRocket $30,925
ETV | Twilio Segment $15,472
ETV | $84,883 | 50% |
Dictionaries 2 competitors | Fullstory $37,591
ETV | Statsig $27,528
ETV | $65,119 | 27% |
Internet 9 competitors | LogRocket $26,400
ETV | Hotjar $8,431
ETV | $63,837 | 68% |
Jobs & Education 7 competitors | Statsig $20,292
ETV | Fullstory $16,935
ETV | $61,886 | 17% |
Software Development 6 competitors | LogRocket $36,519
ETV | Heap $10,715
ETV | $61,097 | 71% |
Sports & Fitness 1 competitor | LogRocket $58,188
ETV | No runner up | $58,188 | 100% |
Arts & Entertainment 9 competitors | LogRocket $20,296
ETV | Statsig $12,974
ETV | $57,401 | 36% |
Internet Software & Web Goodies 9 competitors | Amplitude $13,775
ETV | LogRocket $9,184
ETV | $42,802 | 33% |
Surveys 2 competitors | Fullstory $31,218
ETV | Hotjar $5,529
ETV | $36,747 | 82% |
Programming & Developer Software 3 competitors | LogRocket $20,719
ETV | Heap $10,674
ETV | $32,262 | 48% |
Web Stats & Internet Analytics 6 competitors | Amplitude $12,630
ETV | Hotjar $7,878
ETV | $29,256 | 38% |
Business Management Software 8 competitors | Amplitude $12,171
ETV | Fullstory $9,296
ETV | $28,555 | 24% |
Industrial Goods & Manufacturing 3 competitors | Statsig $23,379
ETV | LaunchDarkly $1,241
ETV | $25,289 | 95% |
Design & Engineering 2 competitors | LogRocket $22,783
ETV | Pendo $1,376
ETV | $24,159 | 94% |
Finance 1 competitor | Amplitude $23,327
ETV | No runner up | $23,327 | 100% |
Law & Government 1 competitor | Statsig $22,813
ETV | No runner up | $22,813 | 100% |
Web Design & Development 2 competitors | LogRocket $20,362
ETV | Hotjar $601
ETV | $20,963 | 97% |
Graphic Design 1 competitor | LogRocket $20,657
ETV | No runner up | $20,657 | 100% |
Education & Training 1 competitor | Statsig $19,323
ETV | No runner up | $19,323 | 100% |
Hobbies & Leisure 3 competitors | LogRocket $13,146
ETV | Pendo $1,462
ETV | $15,467 | 89% |
Telephony 5 competitors | Twilio Segment $12,055
ETV | Fullstory $1,434
ETV | $14,742 | 88% |
Software & Application Frameworks 1 competitor | LogRocket $10,433
ETV | No runner up | $10,433 | 100% |
Java Software 1 competitor | LogRocket $10,352
ETV | No runner up | $10,352 | 100% |
Business Intelligence Software 3 competitors | Amplitude $7,532
ETV | Mixpanel $1,877
ETV | $10,254 | 75% |
Health 1 competitor | Statsig $8,872
ETV | No runner up | $8,872 | 100% |
Phone Plans 1 competitor | Twilio Segment $4,308
ETV | No runner up | $4,308 | 100% |
Customer Support & Outreach 1 competitor | Pendo $3,665
ETV | No runner up | $3,665 | 100% |
Internet Marketing 2 competitors | Hotjar $1,857
ETV | Twilio Segment $1,598
ETV | $3,455 | 14% |
Consumer Electronics 1 competitor | Twilio Segment $2,544
ETV | No runner up | $2,544 | 100% |
Geographic Reference 1 competitor | LaunchDarkly $2,284
ETV | No runner up | $2,284 | 100% |
Software Testing 1 competitor | LaunchDarkly $1,945
ETV | No runner up | $1,945 | 100% |
Business Process Analysis 1 competitor | Pendo $1,486
ETV | No runner up | $1,486 | 100% |
Middleware 1 competitor | Twilio Segment $660
ETV | No runner up | $660 | 100% |
Mobile Phones & Accessories 1 competitor | Heap $134
ETV | No runner up | $134 | 100% |
Top Keywords by Category
Keywords driving category dominance for competitors of posthog.com
Business & Industrial
| Keyword | Competitor | Position | SV | KD | ETV |
|---|---|---|---|---|---|
| amplitude | #1 | 73,632 | 63 | $22,496 | |
| cause and effect vs correlation | #1 | 0 | 20 | $10,062 | |
| correlation and causation | #1 | 1,663 | 30 | $10,062 | |
| correlation or causation | #1 | 415 | 30 | $10,062 | |
| correlation vs causation | #1 | 13,018 | 30 | $10,062 | |
| segment | #1 | 24,380 | 40 | $8,238 | |
| mixpanel | #1 | 18,100 | 44 | $4,182 | |
| experimental controls | #1 | 800 | 5 | $2,462 | |
| control experimental | #1 | 800 | 19 | $2,462 | |
| what are experimental controls | #1 | 6,600 | 5 | $2,006 |
Computers & Consumer Electronics
| Keyword | Competitor | Position | SV | KD | ETV |
|---|---|---|---|---|---|
| causation vs correlation | #1 | 6,300 | 12 | $10,062 | |
| correlational vs causal | #1 | 0 | 22 | $10,062 | |
| heap | #2 | 34,242 | 56 | $6,561 | |
| heap app | #1 | 65 | 44 | $3,010 | |
| what is experimental control | #1 | 6,600 | 1 | $2,006 | |
| type of data types | #1 | 0 | 33 | $1,338 | |
| categorical data vs quantitative | #1 | 4,400 | 4 | $1,338 | |
| quantitative versus categorical variables | #1 | 4,400 | 5 | $1,338 | |
| qualitative data vs quantitative data | #1 | 4,400 | 13 | $1,338 | |
| categorical vs quantitative | #1 | 4,400 | 25 | $1,338 |
Computers
| Keyword | Competitor | Position | SV | KD | ETV |
|---|---|---|---|---|---|
| causation vs correlation | #1 | 6,300 | 12 | $10,062 | |
| correlational vs causal | #1 | 0 | 22 | $10,062 | |
| heap | #2 | 34,242 | 56 | $6,561 | |
| heap app | #1 | 65 | 44 | $3,010 | |
| what is experimental control | #1 | 6,600 | 1 | $2,006 | |
| type of data types | #1 | 0 | 33 | $1,338 | |
| categorical data vs quantitative | #1 | 4,400 | 4 | $1,338 | |
| quantitative versus categorical variables | #1 | 4,400 | 5 | $1,338 | |
| qualitative data vs quantitative data | #1 | 4,400 | 13 | $1,338 | |
| categorical vs quantitative | #1 | 4,400 | 25 | $1,338 |
Software
| Keyword | Competitor | Position | SV | KD | ETV |
|---|---|---|---|---|---|
| causation vs correlation | #1 | 6,300 | 12 | $10,062 | |
| correlational vs causal | #1 | 0 | 22 | $10,062 | |
| heap | #2 | 34,242 | 56 | $6,561 | |
| heap app | #1 | 65 | 44 | $3,010 | |
| what is experimental control | #1 | 6,600 | 1 | $2,006 | |
| type of data types | #1 | 0 | 33 | $1,338 | |
| categorical data vs quantitative | #1 | 4,400 | 4 | $1,338 | |
| quantitative versus categorical variables | #1 | 4,400 | 5 | $1,338 | |
| qualitative data vs quantitative data | #1 | 4,400 | 13 | $1,338 | |
| categorical vs quantitative | #1 | 4,400 | 25 | $1,338 |
Business Management
| Keyword | Competitor | Position | SV | KD | ETV |
|---|---|---|---|---|---|
| cause and effect vs correlation | #1 | 0 | 20 | $10,062 | |
| segment | #1 | 24,380 | 40 | $8,238 | |
| mixpanel | #1 | 18,100 | 44 | $4,182 | |
| quantitative data explanation | #1 | 5,400 | 26 | $1,642 | |
| categorical quantitative | #1 | 4,400 | 3 | $1,338 | |
| qualitative data vs quantitative data | #1 | 4,400 | 13 | $1,338 | |
| quantitative vs categorical | #1 | 4,400 | 25 | $1,338 | |
| quantitative vs categorical variables | #1 | 4,400 | 26 | $1,338 | |
| qualitative data versus quantitative | #1 | 4,400 | 29 | $1,338 | |
| qualitative data versus quantitative data | #1 | 4,400 | 29 | $1,338 |
+41 more categories not shown
Top Pages by Traffic
The highest-traffic pages for posthog.com and its competitors
Amplitude
Mixpanel
Statsig
Heap
Pendo
+5 more competitors not shown
Keyword Gaps
Keywords competitors rank for that posthog.com doesn't
| Keyword | SV | KD | Competitors | Best Pos | Best Competitor | ETV |
|---|---|---|---|---|---|---|
6 9s Quick Win | 0 | 8 | 1 | #1 | $50,160 | |
causation vs correlation Quick Win | 6,300 | 12 | 1 | #1 | $10,062 | |
causal vs correlation Quick Win | 415 | 20 | 1 | #1 | $10,062 | |
cause and effect vs correlation Quick Win | 0 | 20 | 1 | #1 | $10,062 | |
correlational vs causal | 0 | 22 | 1 | #1 | $10,062 | |
correlation and causation | 1,663 | 30 | 1 | #1 | $10,062 | |
correlation or causation | 415 | 30 | 1 | #1 | $10,062 | |
correlation vs causation | 13,018 | 30 | 1 | #1 | $10,062 | |
stat sig | 14,800 | 32 | 1 | #1 | $4,499 | |
experimental controls Quick Win | 800 | 5 | 1 | #1 | $2,462 | |
experimental control Quick Win | 6,498 | 11 | 1 | #1 | $2,462 | |
control experimental Quick Win | 800 | 19 | 1 | #1 | $2,462 | |
what is experimental control Quick Win | 6,600 | 1 | 1 | #1 | $2,006 | |
what are experimental controls Quick Win | 6,600 | 5 | 1 | #1 | $2,006 | |
quantitative data explanation | 5,400 | 26 | 1 | #1 | $1,642 | |
meaning qualitative data | 5,400 | 29 | 1 | #1 | $1,642 | |
meaning of quantitative data | 0 | 32 | 1 | #1 | $1,642 | |
quantitative data meaning | 5,400 | 32 | 1 | #1 | $1,642 | |
users id Quick Win | 0 | 6 | 1 | #1 | $1,338 | |
type of data types | 0 | 33 | 1 | #1 | $1,338 | |
categorical versus quantitative Quick Win | 4,400 | 2 | 1 | #1 | $1,338 | |
categorical quantitative Quick Win | 4,400 | 3 | 1 | #1 | $1,338 | |
categorical data vs quantitative Quick Win | 4,400 | 4 | 1 | #1 | $1,338 | |
categorical or quantitative Quick Win | 4,400 | 4 | 1 | #1 | $1,338 | |
quantitative and categorical Quick Win | 4,400 | 4 | 1 | #1 | $1,338 | |
quantitative or categorical Quick Win | 0 | 4 | 1 | #1 | $1,338 | |
categorical and quantitative Quick Win | 4,400 | 5 | 1 | #1 | $1,338 | |
quantitative versus categorical Quick Win | 4,400 | 5 | 1 | #1 | $1,338 | |
quantitative versus categorical variables Quick Win | 4,400 | 5 | 1 | #1 | $1,338 | |
qualitative data vs quantitative data Quick Win | 4,400 | 13 | 1 | #1 | $1,338 |
+70 more keywords not shown
Paid Ads Intelligence
Top-performing Google and Meta ads from competitors of posthog.com. Analyze their messaging angles and creative strategies.
Competitor ads analyzed
50 Google Ads, 0 Meta Ads across 10 competitors.
Top Messaging Angles
Amplitude Product Analytics - Understand Customer Behavior
Understand user behavior to grow your product. Build better products by turning user data into meaningful insights. Explore a live demo.
amplitude.com
amplitude.com
Amplitude Product Analytics
Understand user behavior to grow your product.
amplitude.com
Amplitude Digital Analytics
Unlock the Power of Your Products with Amplitude’s Digital Analytics Platform.
www.amplitude.com/
Amplitude Digital Analytics
Unlock the Power of Your Products with Amplitude’s Digital Analytics Platform.
www.amplitude.com/
mixpanel.com
mixpanel.com
mixpanel.com
mixpanel.com
#1 Product Analytics Software - Get Started in 5 Minutes
Mixpanel® Gives You Detailed, Real-Time Insight Into How Users Interact with Products. Track User...
www.mixpanel.com/product/analytics
Statsig: Build Better Products
Thousands of companies rely on Statsig feature flags, experimentation, and analytics.
www.statsig.com/
Statsig: Build Better Products
Thousands of companies rely on Statsig feature flags, experimentation, and analytics.
www.statsig.com/
Run A/B Tests Effortlessly - #1 A/B Testing Platform
Built for product, engineering and data teams. Make better decisions with robust A/B tests Try end-to-end...
www.statsig.com/
Simplify Feature Flagging - Unlimited Feature Flags
Turn every feature flag into an A/B test. Empower your product team for scalable growth Manage and control...
www.statsig.com/
statsig.com
Get The Why Behind Your Users
Learn why Google Analytics alone isn't enough for your team. Request your free demo now.
www.heap.io/
heap.io
heap.io
5 Metrics For Product Success
Discover the best ways to measure key product areas & the metrics you should avoid.
heap.io
Try Heap Instead
With Heap there is no need to be a data scientist to get actionable insights from data.
www.heap.io/
Pendo.io - Product Experience Solutions
See how companies deliver great product experiences with Pendo Empower users to make...
go.pendo.io/
pendo.io
pendo.io
pendo.io
Pendo.io
Pendo improves the apps you build, buy, and sell so you can deliver better experiences.
go.pendo.io/
launchdarkly.com
launchdarkly.com
launchdarkly.com
Manage Feature Toggles - Get A LaunchDarkly Demo
LaunchDarkly™ Helps Developers Target Users, Roll out Features, & De-Risk Dev Cycles. Create, Organize & Maintain Flags at any Scale. Sign up for a Demo Today!
launchdarkly.com
Feature Flagging as a Service - Get the Free O'Reilly Guide
Deploy when you want, release when you're ready, and enable more product innovation. Adopt feature management practices to deploy every 6 hours instead of every 6 weeks.
www.launchdarkly.com/
fullstory.com
fullstory.com
fullstory.com
fullstory.com
fullstory.com

Hotjar.com™ - offizielle seite
Erlebe vollständige nutzer-transparenz auf deiner website mit Hotjar. Demo buchen.
www.hotjar.com/
Hotjar.com™ - offizielle seite
Erhalte unbezahlbare einblicke in verhalten, bedürfnisse und emotionen der nutzer!
www.hotjar.com/
Hotjar™ website heatmaps
Das all-in-one-tool für UX und marketing teams. Mehr kunden durch eine optimierte website.
hotjar.com
Sitio oficial de Hotjar.com™
Entiende al momento cómo actúan los visitantes en tu web, qué necesitan y qué piensan.
www.hotjar.com/
Digital Experience Analytics
Más de 1.3 millones de webs confían en Hotjar para las analíticas y los datos sobre comportamiento del usuario.
www.hotjar.com/
Visit Site
Learn why LogRocket is the top ranked Session Replay provider on G2 Crowd.
lp.logrocket.com
Visit Site
Learn why LogRocket is the #1 ranked session replay solution on G2 Crowd. Get a demo now.
lp.logrocket.com
logrocket.com
Session Recording Solution
Reproduce every user session with a pixel-perfect replay.
lp.logrocket.com/
Visit Site
Learn why LogRocket is the #1 ranked Session Replay solution on G2.
logrocket.com
Segment Customer Data Platform - Customer Data Analytics
Build personalized customer experiences to increase Customer LTV, Conversion rates, & AOV Create...
www.segment.com/cdp/analytics
segment.com
Customer Data Platform - A Single View Of Customer Data
Segment’s AI allows you to create the most relevant customer experiences in minutes Segment establishes a modern customer data foundation and helps make data...
www.segment.com/cdp
Segment
Segment’s AI allows you to create the most relevant customer experiences in minutes
www.segment.com/
Segment Customer Data Platform - Customer Data Platform
Segment’s AI allows you to create the most relevant customer experiences in minutes
www.segment.com/cdp
Ad Landing Pages
Top-performing landing pages from competitors of posthog.com. Analyze their conversion angles, CTAs, and offers.
Landing pages analyzed
Top 3 landing pages per competitor, selected from longest-running ads.
Angle
AI analytics platform positioned as “the AI analytics platform for testing everything,” promising an “unfair AI advantage” to help you grow.
CTA
"Start your free analytics trial "
Offer
Free analytics trial
Angle
Product analytics positioned as “analytics that drive decisions,” turning user behavior insights into clear next steps without delays or SQL bottlenecks.
CTA
"Get Started Free "
Offer
Free (via “Get Started Free”)
Angle
Product analytics positioned as “analytics that drive decisions,” turning user behavior insights into clear next steps without delays or SQL bottlenecks.
CTA
"Get Started Free "
Offer
Free (via “Get Started Free”)
Angle
Modern product development platform focused on tying measurement to releases: “Measure what ships. Ship what matters.”
CTA
"Create a free account "
Offer
Free account
Angle
Digital insights platform promising “Better Insights. Faster.” with complete understanding of customers’ end-to-end digital journeys to improve conversion/retention.
CTA
"Free Trial "
Offer
Free Trial; also promotes “Unlock 2025 Benchmark data → Get the Report.”
Angle
Login-focused page prompting existing users to sign in to Pendo.
CTA
"Sign In "

Angle
Product experience/analytics platform framed as: “Understand and guide users. Then prove impact.”
CTA
"Get a demo "
Offer
Mentions Pendomonium 2026 “early bird pricing.”
Angle
Developer-focused platform to “ship with confidence” by combining feature flags, observability, experimentation, analytics, and AI configuration to de-risk releases.
CTA
"Start building free "
Offer
Start building free
Angle
Behavioral data & digital analytics platform promising “Better data. Better digital experiences.” with always-on AI-agent analysts.
CTA
"Get a demo "
Angle
“Say goodbye to boring data” positioning: Fullstory “unlocks the true sentiment behind every click” so you understand why users click and how to keep them returning.
CTA
"Watch Video "
Angle
Website behavior analytics tools (heatmaps, session replay, funnels, surveys, etc.) positioned as a unified, easy-to-use platform to go “from insight to impact, fast” (now part of Contentsquare).
CTA
"Get started free "
Offer
Get started free — No credit card required
Angle
AI-first digital experience analytics for web & mobile, focused on reproducing issues with session replay and surfacing usability/technical problems.
CTA
"Request a Demo "
Offer
Try for 14 days free
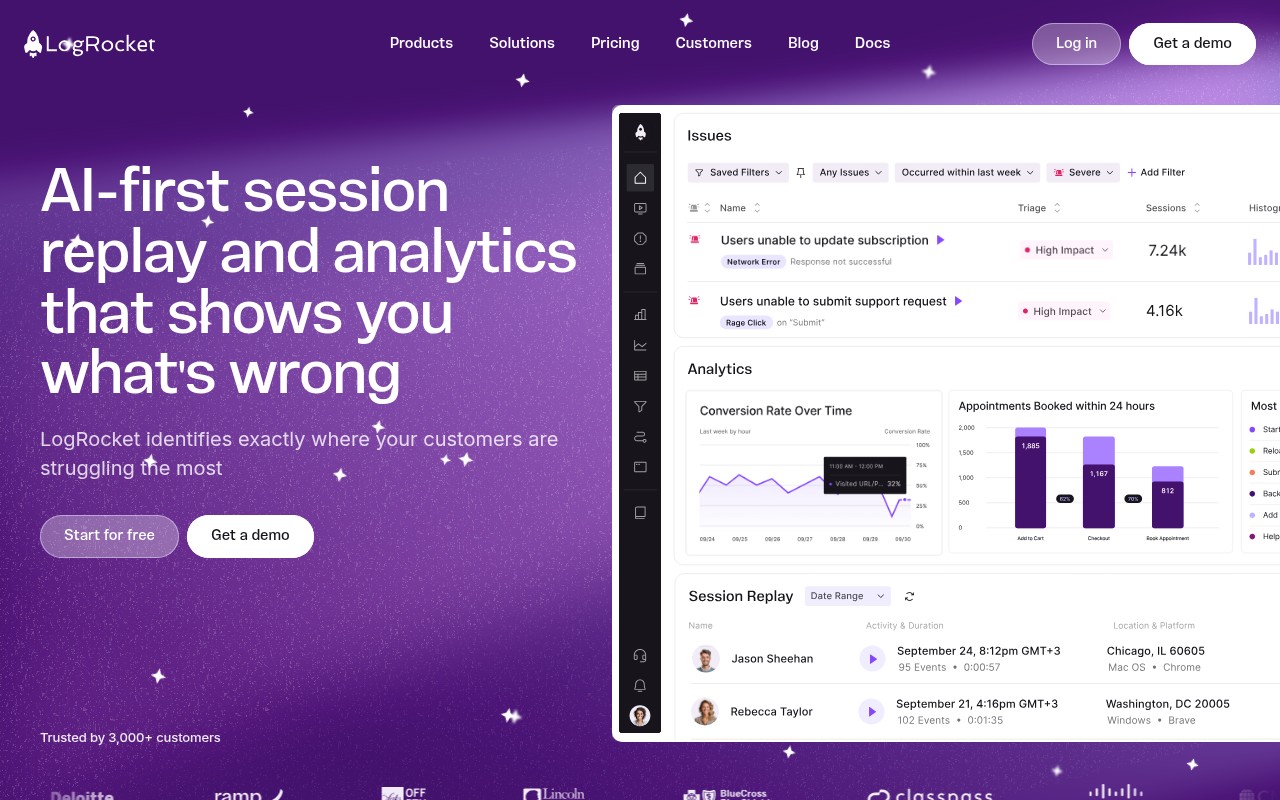
Angle
AI-first session replay and analytics positioned to show “exactly where your customers are struggling the most.”
CTA
"Start for free "
Offer
Start for free
Angle
Customer Data Platform positioned as “the leading customer data platform, powered by AI,” unifying clean/consented data for real-time insights and personalization.
CTA
"Create a free account "
Offer
Free account
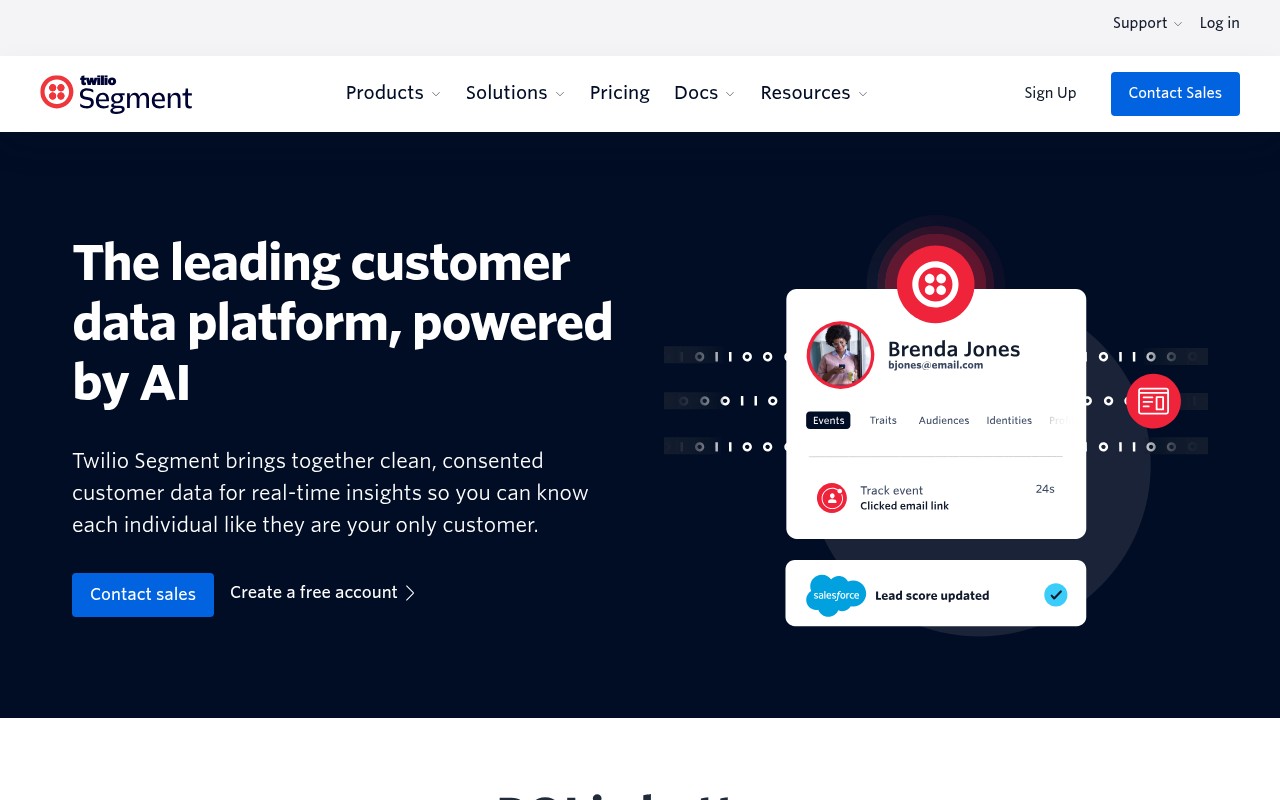
Angle
Customer Data Platform positioned as “the leading customer data platform, powered by AI,” unifying clean/consented data for real-time insights and personalization.
CTA
"Create a free account "
Offer
Free account
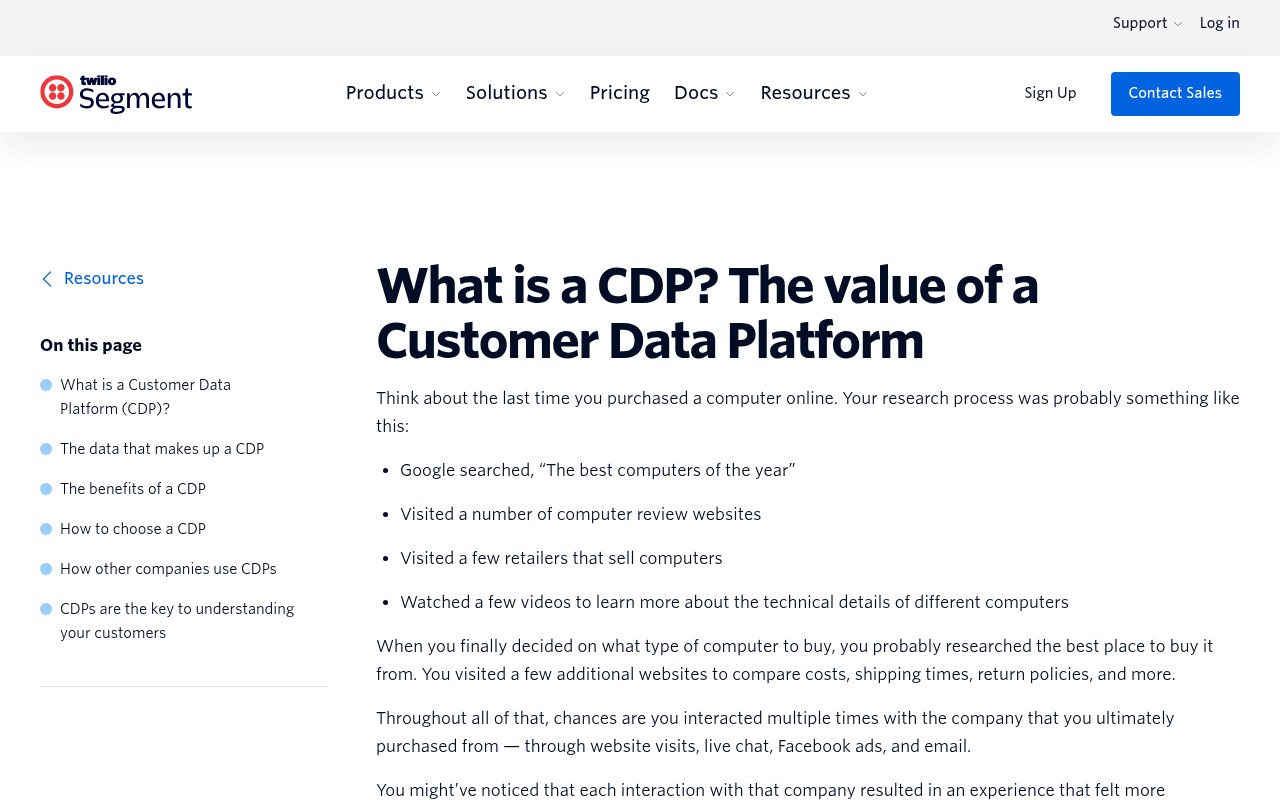
Angle
Customer Data Platform positioned as “the leading customer data platform, powered by AI,” unifying clean/consented data for real-time insights and personalization.
CTA
"Create a free account "
Offer
Free account
2×2 Competitor Map
Strategic positioning map for competitors of posthog.com. Visualize where competitors fall on key strategic dimensions.
Competitors mapped
Positioned by audience orientation: ux/marketing/product (0) → engineering/data/devops (100) vs offering scope: point tool (0) → enterprise platform suite (100).
↓ Offering scope: Point tool (0) → Enterprise platform suite (100) ↑
← Audience orientation: UX/Marketing/Product (0) → Engineering/Data/DevOps (100) →
Interpretation
Top-right is a red-ocean cluster (Amplitude, Mixpanel, Statsig, LaunchDarkly, Segment) competing on overlapping “platform” promises—winning here usually requires sharper category focus (e.g., experimentation-first vs CDP-first) or differentiated packaging/pricing. Bottom-left and bottom-right are whitespace: either a truly lightweight UX insights tool or a focused developer diagnostics product can stand out faster than another broad enterprise platform.
Top Opportunities
Your next steps based on competitive insights for posthog.com
Position in "Lightweight UX Insight Tools (Whitespace)" - 2 whitespace quadrants vs 1 crowded
Use sales ammo: "Could be great to have more third-party integrations (e.g., ..." - Amplitude
Swipe landing page angle from LaunchDarkly: "Developer-focused platform to “ship with confidence” by combining feature flags, observability, experimentation, analytics, and AI configuration to de-risk releases. "
How to prioritize
- 1. Quick wins first: keyword gaps and feature gaps you can address this week
- 2. Messaging next: update your landing page angles and sales talk tracks
- 3. Strategic moves last: pricing changes and positioning shifts require more planning